|
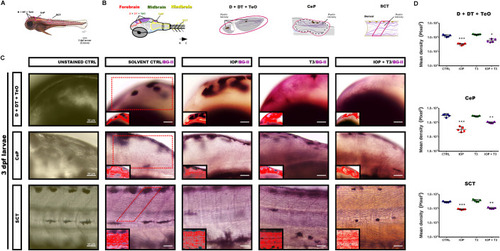
Whole mount Black-Gold II staining of zebrafish larvae at 3 dpf.(A) Side view painting of 3 dpf zebrafish larva showing D + DT + TeO; CeP and SCT location; (B) Schematic drawing of the brain region (forebrain, midbrain and hindbrain) with identification of myelinated longitudinal axons in a violet color. (C) Representative photomicrograph of zebrafish larvae with lateral view and R-C orientation, whole-mount Black-Gold II staining in D + DT + TeO; CeP and SCT at 3 dpf (Unstained CTRL, Solvent Ctrl/BG-II, IOP/BG-II, T3/BG-II and IOP + T3/BGII). In each corner, the amplification of sagittal sections identifying the selected area for analysis and the positive myelin pixels, recognized by the IPP6 program; scale bar: 500 μm and 50 μm. (D) Quantification of myelin density expressed as myelinated area (MA) in pixels2 in D + DT + TeO; CeP and SCT in CTRL, IOP, T3 and IOP + T3 larvae (mean ± SEM with n = 5/condition). Statistical analysis was performed with one-way ANOVA coupled with Tukey’s multiple comparison test with respect to the control group. *p <0.05, **p <0.01, ***p <0.001.
|