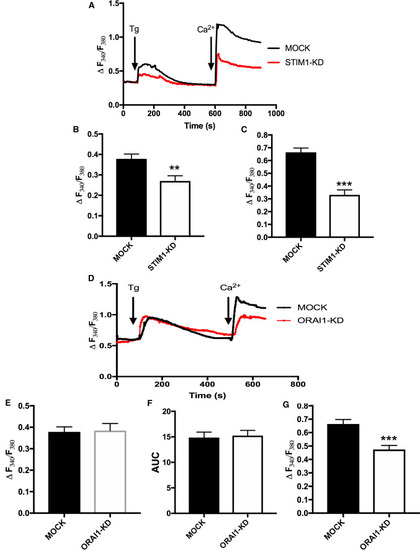
A Representative traces showing Thapsigargin-evoked (Tg, final concentration, 1 μM) changes in [Ca2+]i in MOCK and STIM1-KD cells in calcium-free buffer and the effect of re-addition of 1 mM calcium (final concentration).B Bar diagram showing the magnitude of the Tg-evoked peak in [Ca2+]i. The bars show the mean ± S.E. of at least 40 cells. p < 0.01. C Bar diagram showing the magnitude of the change in [Ca2+]i after re-addition of calcium (final concentration, 1 mM) to Tg-treated cells. The bars show the mean ± S.E. of at least 40 cells. ***p < 0.001. D Representative traces showing Tg-evoked (final concentration, 1 μM) changes in [Ca2+]i in MOCK and ORAI1-KD cells in calcium-free buffer and the effect of readdition of 1 mM calcium. E Bar diagram showing the magnitude of the Tg-evoked peak in [Ca2+]i. The bars show the mean ± S.E. of at least 40 cells. F Bar diagram showing the area under the Tg curve (time, 60–480 s). The bars show the mean ± S.E. of at least 40 cells. G Bar diagram showing the magnitude of the change in [Ca2+]i after readdition of calcium (final concentration, 1 mM) to Tg-treated cells. The bars show the mean ± S.E. of at least 40 cells. ***p < 0.001
|

