
FIGURE
Figure 10
Figure 10
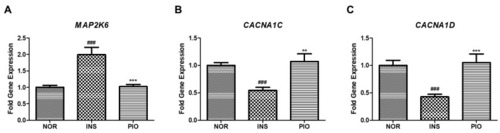
Differential gene expression induced by insulin-treated zebrafish. (A) The map2k6 gene was determined by RT-qPCR. (###) p < 0.001; compared to normal group (NOR). (***) p < 0.001; compared to insulin-treated group (INS). (B) The cacna1c gene was determined by RT-qPCR. (###) p < 0.001; compared to normal group (NOR). (**) p < 0.01; compared to insulin-treated group (INS). (C) The cacna1d gene was determined by RT-qPCR. (###) p < 0.001; compared to normal group (NOR). (***) p < 0.001; compared to insulin-treated group (INS). |
Expression Data
Expression Detail
Antibody Labeling
Phenotype Data
Phenotype Detail
Acknowledgments
This image is the copyrighted work of the attributed author or publisher, and
ZFIN has permission only to display this image to its users.
Additional permissions should be obtained from the applicable author or publisher of the image.
Full text @ Pharmaceuticals (Basel)