
FIGURE
Figure 9
Figure 9
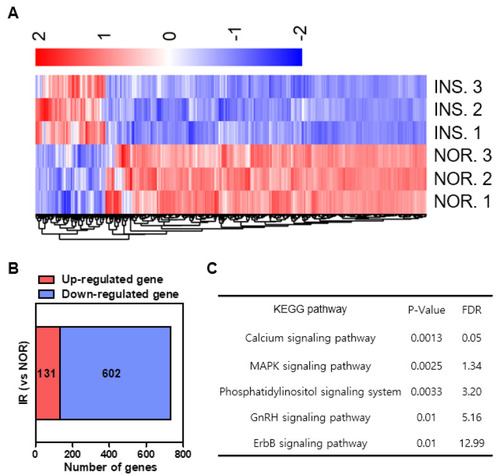
Differential gene expression induced by insulin-treated group (INS) compared to normal group (NOR). (A) Heat map based on RNA-sequencing analysis of the gene expression in zebrafish. (B) RNA-sequencing for the excess insulin treatment-regulated gene set. (C) KEGG pathways. |
Expression Data
Expression Detail
Antibody Labeling
Phenotype Data
Phenotype Detail
Acknowledgments
This image is the copyrighted work of the attributed author or publisher, and
ZFIN has permission only to display this image to its users.
Additional permissions should be obtained from the applicable author or publisher of the image.
Full text @ Pharmaceuticals (Basel)