
FIGURE
Figure 7
Figure 7
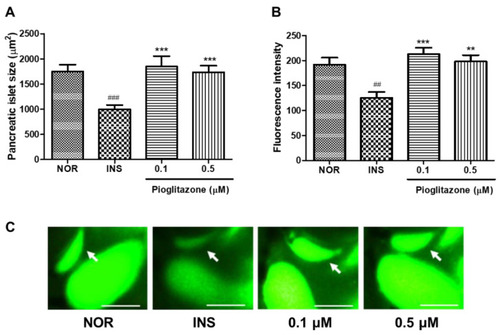
Effects of pioglitazone (PIO) on excess insulin-treated zebrafish. (A) Pancreatic islets’ size. (###) p < 0.001; compared to normal group (NOR). (***) p < 0.001; compared to insulin-treated group (INS). (B) Fluorescence intensity in the pancreatic islets. (##) p < 0.01; compared to NOR. (**) p < 0.01, (***) p < 0.001; compared to INS. (C) Representative pancreatic islet images of the NOR, INS, PIO-treated zebrafish. Pancreatic islets were stained using 2-NBDG. The white arrow indicates the location of pancreatic islet. Scale bar = 100 μm. |
Expression Data
Expression Detail
Antibody Labeling
Phenotype Data
Phenotype Detail
Acknowledgments
This image is the copyrighted work of the attributed author or publisher, and
ZFIN has permission only to display this image to its users.
Additional permissions should be obtained from the applicable author or publisher of the image.
Full text @ Pharmaceuticals (Basel)