
Figure 6.
- ID
- ZDB-FIG-210802-43
- Publication
- Schroeder et al., 2021 - Distinct Synaptic Transfer Functions in Same-Type Photoreceptors
- Other Figures
- All Figure Page
- Back to All Figure Page
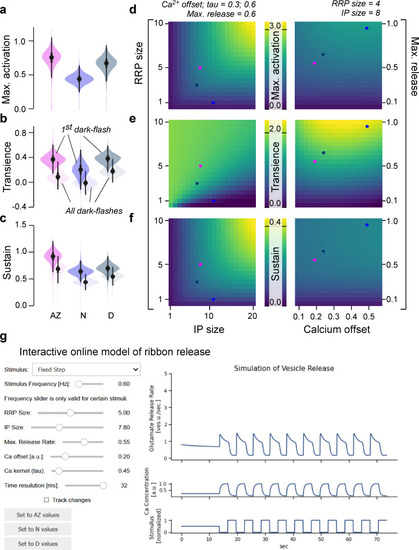
(a-c) The same indices as in Figure 3, but here calculated on 10,000 model evaluations on samples from the posteriors. The model has learned the differences between the retinal regions and reproduces these differences (see Figure 3 for comparison). (d-f) Indices as in (a–c), calculated on different parameter combinations as indicated. For this analysis, a step-stimulus feeding into a linear calcium model was added as the input to the release model (Materials and methods). For definition of the indices, see also Figure 3b. (g) Screenshot of the interactive online model, available at http://www.tinyurl.com/h3avl1ga. |