
Figure 3
- ID
- ZDB-FIG-210802-26
- Publication
- Schroeder et al., 2021 - Distinct Synaptic Transfer Functions in Same-Type Photoreceptors
- Other Figures
- All Figure Page
- Back to All Figure Page
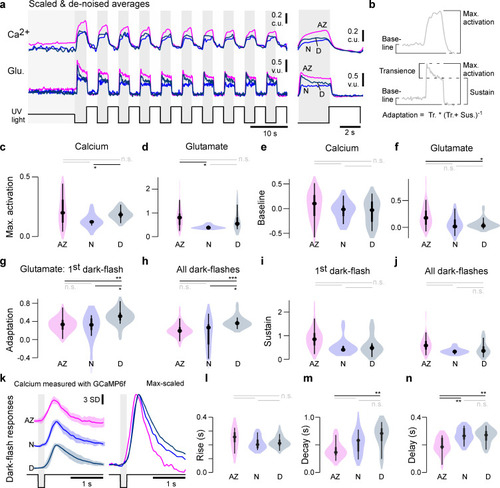
(a) Scaled and denoised calcium and glutamate recordings averaged across multiple regions of interest (ROIs) (Materials and methods). We refer to the scaling as calcium units (c.u.) and vesicle units (v.u.) as the same traces also serve as input for the biophysical model (see Figure 4). (b) Schema of the calculated indices in (c–j) (Materials and methods). The transience index is computed as max.-sustainmax. (c–j) Quantification of physiological differences for the three different retinal regions (two-sided shuffling test with Bonferroni correction, nAZ, nN, nD = 30, 9, 16, *p<0.05, **p<0.01, ***p<0.001). (k) GCaMP6f recordings from Yoshimatsu et al., 2020b. Mean ± SD and overlaid mean traces in response to a 200 ms dark flash stimulus. (l–n) Quantification of physiological differences for the GCaMP6f recordings: time constants for an exponential rise, decay, as well as delay time to response (see also Materials and methods) (two-sided shuffling test with Bonferroni correction, nAZ, nN, nD = 13, 17, 22, *p<0.05, **p< 0.01, ***p<0.001). |