
Figure 4
- ID
- ZDB-FIG-210802-40
- Publication
- Schroeder et al., 2021 - Distinct Synaptic Transfer Functions in Same-Type Photoreceptors
- Other Figures
- All Figure Page
- Back to All Figure Page
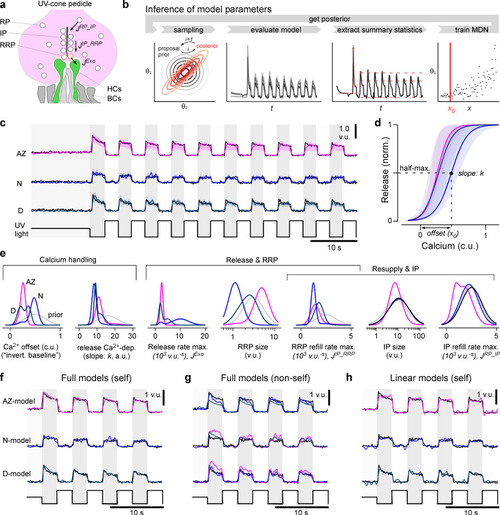
(a) Schema of the movement of vesicles at a ribbon synapse. The vesicles move from the reserve pool (RP) to the intermediate pool (IP) at the ribbon and finally to the readily releasable pool (RRP) close to the membrane before they are released into the synaptic cleft to activate the dendrites of invaginating horizontal cells (HCs). (b) Schema of the parameter inference: over several rounds, samples are first drawn from a prior, the model is then evaluated and summary statistics on which the relevant loss function is calculated are extracted. Based on these values and the sampled parameters, a mixture of density network (MDN) is trained and evaluated to get the posterior/prior for the next round. (c) Model predictions for the three regions (mode and 90% prediction intervals from posterior samples in colour, data in black). (d) Mode and 90% prediction intervals of the model’s non-linearity. (e) Prior and one-dimensional marginals of the posterior distributions (see Figure 4—figure supplement 1a for the two-dimensional marginals). The units are vesicle units (v.u.) and calcium units (c.u.), referring to the scale invariance of the model. (f) Evaluation of the best region-specific models on its region-specific calcium traces. (g) Evaluation of best region-specific model on the calcium races of the other regions. (h) Evaluation of the linear baseline model (model in colour, data in black): especially the transient components are missed. See Figure 3—figure supplement 1b for a quantification of the goodness of fits. |