|
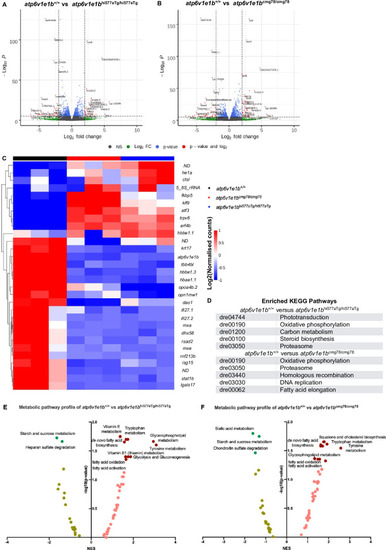
Transcriptomic and metabolomic signature of <italic toggle='yes'>atp6v1e1b</italic> deficiency <italic toggle='yes'>in vivo</italic>.(A) Volcano plot of RNA-sequencing data of atp6v1e1bhi577aTg/hi577aTg. (B) Volcano plot of RNA-sequencing data of atp6v1e1bcmg78/cmg78. The data represents overlapping genes from both ZFIN and Ensembl reference genome mapping (GRCz11). Red spots represent differentially expressed genes (DEGs). The horizontal line denotes the significance threshold (adjusted p<0.05) for DEGs. The vertical line denotes the Log2 fold change (Fc) threshold of 2. (C) Hierarchical clustering of the top 30 most DEGs from whole-body samples of atp6v1e1b-deficient and WT control zebrafish at 3 dpf. DEGs are annotated with gene names of which the protein function is known. DEGs with unknown gene names are listed in S1 Table. Colors range from red (high expression) to blue (low expression). (D) Results of the KEGG pathway analysis showing the most enriched pathways in the differentially expressed gene list of the whole-body samples from the atp6v1e1b-deficient and WT control zebrafish dataset. (E-F) Plots of an integrated analysis based on Metaboanalyst software (pathway tool) for a simplified view of contributing pathways in whole-body samples of atp6v1e1b-deficient zebrafish at 3 dpf. Full analysis based on GSEA parameters and Mummichog parameters are shown in S2 Table. Dark green and brown symbols represent significantly enriched pathways. ND: not determined; NES: normalized enrichment score.
|