
Figure 4.
- ID
- ZDB-FIG-210709-4
- Publication
- DuMez et al., 2021 - In vivo characterization of carbon dots-bone interactions: toward the development of bone-specific nanocarriers for drug delivery
- Other Figures
- All Figure Page
- Back to All Figure Page
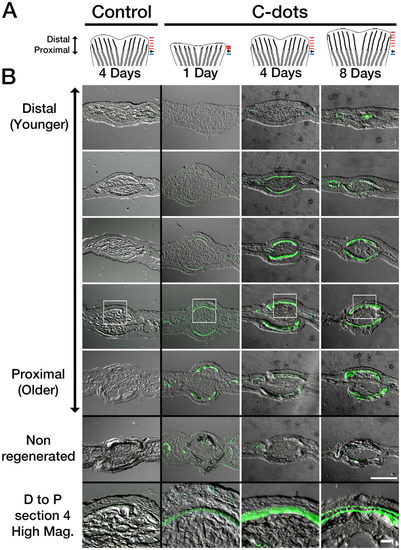
Differential spatiotemporal deposition of C-dots in regenerating bones. (A) Diagram of regenerating fins used in analysis. Amputated fish were injected with saline (control) or C-dots at the indicated times. One hour after injection, fins were re-amputated and processed for cryosectioning. Black arrow indicates amputation site. Red and blue lines indicate the approximate site of sections in regenerating and non-regenerating bones, respectively. (B) Sagittal sections of regenerated and non-regenerated caudal fins ordered in distal (younger) and proximal (older) direction (position corresponding to red and blue lines in A, respectively). Areas of C-dot deposition are green. Areas in white box are shown magnified in the bottom panels. Scale bar is 100 µm for low and 20 µm for high magnification images. |