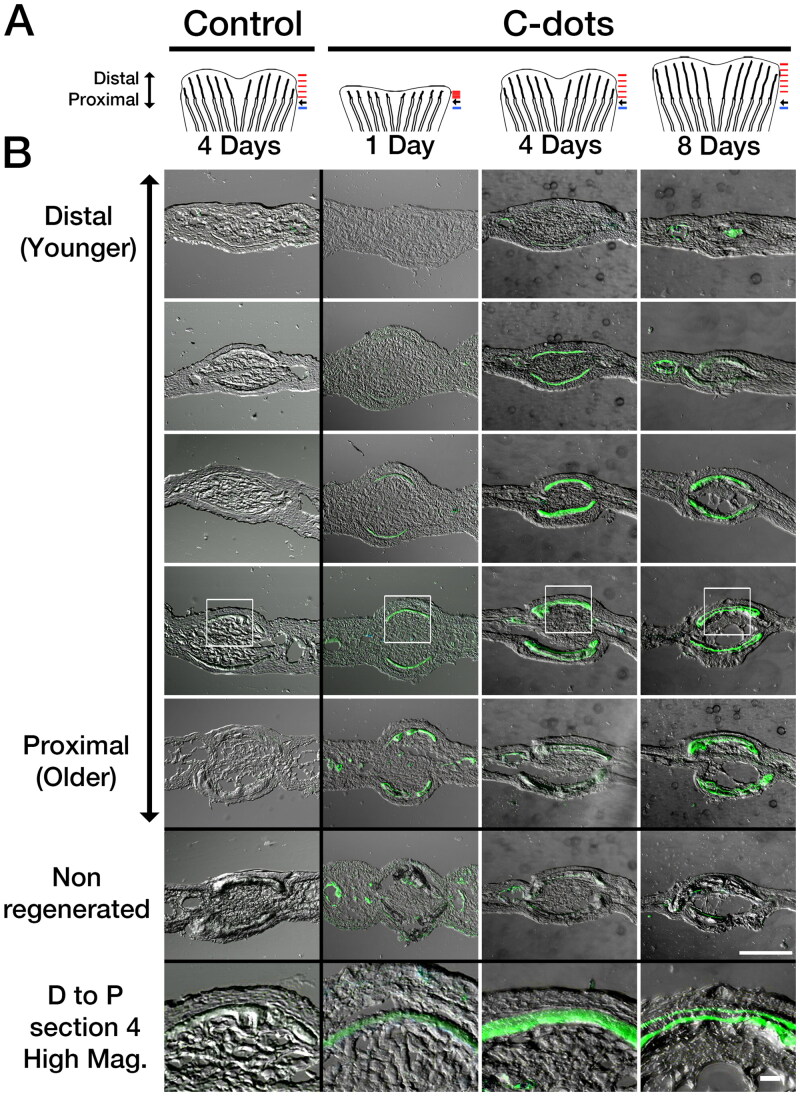
Figure 4. Differential spatiotemporal deposition of C-dots in regenerating bones. (A) Diagram of regenerating fins used in analysis. Amputated fish were injected with saline (control) or C-dots at the indicated times. One hour after injection, fins were re-amputated and processed for cryosectioning. Black arrow indicates amputation site. Red and blue lines indicate the approximate site of sections in regenerating and non-regenerating bones, respectively. (B) Sagittal sections of regenerated and non-regenerated caudal fins ordered in distal (younger) and proximal (older) direction (position corresponding to red and blue lines in A, respectively). Areas of C-dot deposition are green. Areas in white box are shown magnified in the bottom panels. Scale bar is 100 µm for low and 20 µm for high magnification images.
Image
Figure Caption
Acknowledgments
This image is the copyrighted work of the attributed author or publisher, and
ZFIN has permission only to display this image to its users.
Additional permissions should be obtained from the applicable author or publisher of the image.
Full text @ Drug Deliv

