
Figure 3—figure supplement 4.
- ID
- ZDB-FIG-210630-56
- Publication
- Dehmelt et al., 2021 - Spherical arena reveals optokinetic response tuning to stimulus location, size, and frequency across entire visual field of larval zebrafish
- Other Figures
-
- Figure 1
- Figure 1—figure supplement 1.
- Figure 1—figure supplement 2.
- Figure 2
- Figure 2—figure supplement 1.
- Figure 2—figure supplement 2.
- Figure 3
- Figure 3—figure supplement 1.
- Figure 3—figure supplement 2.
- Figure 3—figure supplement 3.
- Figure 3—figure supplement 4.
- Figure 3—figure supplement 5.
- Figure 4
- Figure 4—figure supplement 1
- Figure 4—figure supplement 2.
- Figure 4—figure supplement 3.
- Figure 5
- Figure 5—figure supplement 1.
- Figure 5—figure supplement 2.
- Figure 5—figure supplement 3.
- Figure 6—figure supplement 1.
- Figure 6—figure supplement 1.
- All Figure Page
- Back to All Figure Page
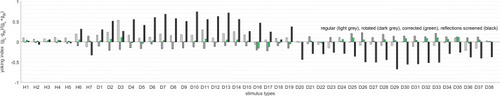
Yoking indices were computed for experiments using the regular setup as in Figure 4a (light grey), with a rotated arena as in Figure 4b (dark grey), corrected for experimental asymmetries as in Figure 3 (green), and with one side of the glass bulb, contralateral to the stimulus centre, painted black (black). Yoking indices from most experiments are close to zero, indicating similar OKR gains for both eyes regardless of stimulus location. In contrast, yoking indices from the latter control experiment differ markedly from zero, indicating significantly weaker responses by the respectively unstimulated eye. This finding points to reflections at the air-glass interface being visible to the purportedly ‘unstimulated’ eye. Stimulus types are listed in the order given in Supplementary file 1B and Supplementary file 1E: the whole-field stimulus H1, hemifield stimuli H2 to H7, and then disk-shaped stimuli D1 to D38 from front to rear, top to bottom, and left hemisphere to right hemisphere. |