
FIGURE
Figure 2—figure supplement 1.
- ID
- ZDB-FIG-210630-50
- Publication
- Dehmelt et al., 2021 - Spherical arena reveals optokinetic response tuning to stimulus location, size, and frequency across entire visual field of larval zebrafish
- Other Figures
-
- Figure 1
- Figure 1—figure supplement 1.
- Figure 1—figure supplement 2.
- Figure 2
- Figure 2—figure supplement 1.
- Figure 2—figure supplement 2.
- Figure 3
- Figure 3—figure supplement 1.
- Figure 3—figure supplement 2.
- Figure 3—figure supplement 3.
- Figure 3—figure supplement 4.
- Figure 3—figure supplement 5.
- Figure 4
- Figure 4—figure supplement 1
- Figure 4—figure supplement 2.
- Figure 4—figure supplement 3.
- Figure 5
- Figure 5—figure supplement 1.
- Figure 5—figure supplement 2.
- Figure 5—figure supplement 3.
- Figure 6—figure supplement 1.
- Figure 6—figure supplement 1.
- All Figure Page
- Back to All Figure Page
Figure 2—figure supplement 1.
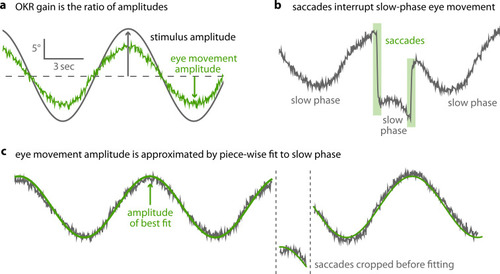
(a) As shown in Figure 2b, optokinetic gain is the ratio between the amplitudes of eye movement and stimulus movement. To extract these, raw eye traces must be processed. (b) OKR eye movements consist of a slow phase, gradually tracking stimulus motion, and intermittent saccades. (c) After pre-processing data to detect and remove saccades, we fit a piece-wise sinusoidal function with a single amplitude to the remaining slow-phase eye traces. The amplitude of the best fit determines OKR gain. |
Expression Data
Expression Detail
Antibody Labeling
Phenotype Data
Phenotype Detail
Acknowledgments
This image is the copyrighted work of the attributed author or publisher, and
ZFIN has permission only to display this image to its users.
Additional permissions should be obtained from the applicable author or publisher of the image.
Full text @ Elife