
FIGURE
Figure 1
- ID
- ZDB-FIG-210628-33
- Publication
- Faria et al., 2021 - Pharmacological Modulation of Serotonin Levels in Zebrafish Larvae: Lessons for Identifying Environmental Neurotoxicants Targeting the Serotonergic System
- Other Figures
- All Figure Page
- Back to All Figure Page
Figure 1
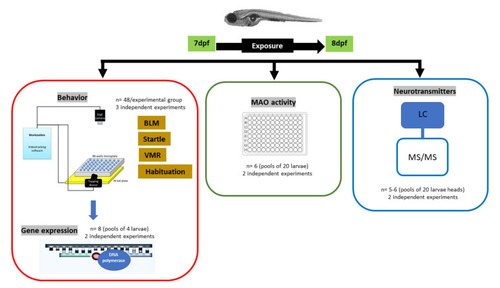
Diagram of the conducted study, indicating the exposure period (from 7 to 8 dpf) and the addressed variables (behavior, gene expression, MAO activity, and neurotransmitters), divided into their corresponding dataset (red, green, and blue squares). Indicated are also the number of larvae and independent experiments used for each variable. |
Expression Data
Expression Detail
Antibody Labeling
Phenotype Data
Phenotype Detail
Acknowledgments
This image is the copyrighted work of the attributed author or publisher, and
ZFIN has permission only to display this image to its users.
Additional permissions should be obtained from the applicable author or publisher of the image.
Full text @ Toxics