FIGURE

Figure 2.

ID
ZDB-FIG-210628-13
Publication
Zhou et al., 2021 - Association between erythrocyte dynamics and vessel remodelling in developmental vascular networks
Other Figures
All Figure Page
Back to All Figure Page
Figure 2.

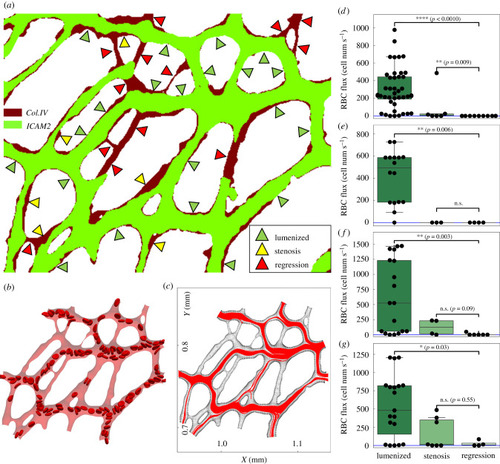
Association between RBC hypoperfusion and vessel regression in the developing retinal network. (a) Classification of vessels based on their ICAM2 and Col.IV signals (here demonstrating ROI-1 as in figure 1a). All vessels in the ROI are divided into three groups, i.e. lumenized, regression and stenosis. (b) A snapshot of the simulation of RBC flow in ROI-1. (c) Combined cell trajectories in ROI-1 throughout the simulation (over 0.49 s). (dg) Statistical test of time-average RBC flux for the mentioned three groups in ROI-1, ROI-2, ROI-3 and ROI-4, respectively. Two-sided Mann–Whitney U test is performed. The sample sizes for the three groups are n = 44, 6, 13 in (d); n = 16, 3, 4 in (e); n = 18, 4, 6 in (f); n = 19, 7, 4 in (g).

Expression Data

Expression Detail
Antibody Labeling
Phenotype Data

Phenotype Detail
Acknowledgments
This image is the copyrighted work of the attributed author or publisher, and ZFIN has permission only to display this image to its users. Additional permissions should be obtained from the applicable author or publisher of the image. Full text @ J. R. Soc. Interface