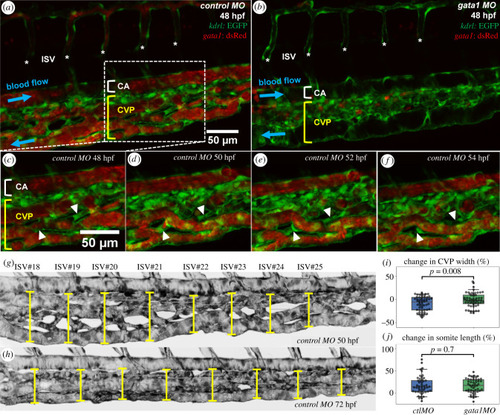
Time-lapse imaging of RBC perfusion and vascular remodelling in zebrafish caudal vein plexus. (a,b) Two exemplar caudal vein plexuses (CVPs, indicated by a square bracket in yellow) from a 48 hpf ctl MO embryo (with RBC perfusion) and a 48 hpf gata1 MO embryo (Tg(GATA-1:eGFP), without RBC perfusion). The intersegmental vessels (ISVs) are marked with asterisks, and the caudal artery (CA) is indicated by square bracket in white. The RBC precursors in (b) are located outside the vasculature and not circulating within the blood stream. (c–f) Time sequence showing vessel regression events in a region of interest extracted from the ctl MO embryo in (a), where two vessel segments marked by white triangles are pruned over time (t = 48 hpf, 50 hpf, 52 hpf, 54 hpf). (g,h) Exemplar measurements of CVP widths (indicated by capped lines) at t = 50 hpf and t = 72 hpf along the anterior–posterior axis of a ctl MO embryo (Z-projection image) at positions given by eight consecutive ISVs (ISV 18–ISV 25). The lengths of corresponding somites (seven counted here for each fish) are estimated by the inter-ISV distances. (i) Normalized CVP width change and (j) normalized somite length change at t = 72 hpf against t = 50 hpf (relative change in percentages), calculated from measurements of the ctl MO group and the gata1 MO group (each containing 7 embryos). The statistical analysis in (i,j) is performed using Welch’s T test, with n = 56 in (i) and n = 49 in (j).
|
