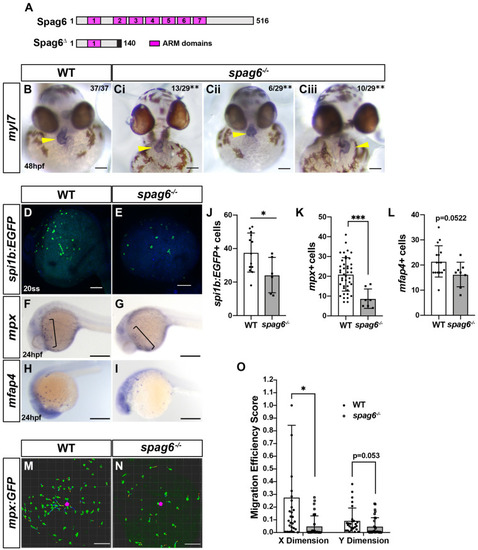
(A) Domain architecture for WT zebrafish Spag6 and the predicted truncation from the spag6 mutant allele used. (B,Ci-iii) ISH for myl7 in WT and spag6 mutant embryos at 48 hpf. (B,Ci) Normally (situs solitus, dextral) looped hearts in WT and spag6 mutant embryos. (Cii) Linearized heart in spag6 mutant. (Ciii) Reverse (situs inversus) heart in spag6 mutant. Yellow arrowheads indicate hearts. Fractions indicate the number of embryos with the given phenotype. **P<0.001 (Fisher's exact test). (D,E) Whole-mount IHC for spi1b:EGFP in WT (n=11) and spag6 mutants (n=8). (F,G) Whole-mount ISH for the neutrophil marker mpx in WT (n=45) and spag6 mutant (n=11) embryos at 24 hpf. (H,I) Whole-mount ISH for the macrophage marker mfap4 in WT (n=19) and spag6 mutant (n=8) embryos at 24 hpf. (J-L) Quantification of myeloid progenitors (spi1b:EGFP+), neutrophils (mpx+) and macrophages (mfap4+) from a single yolk hemisphere of the individual embryos. (M,N) Representative confocal projection images from wounding experiments of WT sibling (n=4) and spag6−/− (n=4) mpx:EGFP transgenic embryos at 24 hpf. (O) Migration efficiency scores from cell tracks of yolk wounding assays in WT and spag6 mutant mpx:EGFP+ embryos at 24 hpf. ***P<0.0001, *P<0.05 (two-tailed unpaired Student's t-test). Scale bars: 50 μm (B-Ciii), 300 μm (F-I), 100 μm (D,E,M,N).
|
