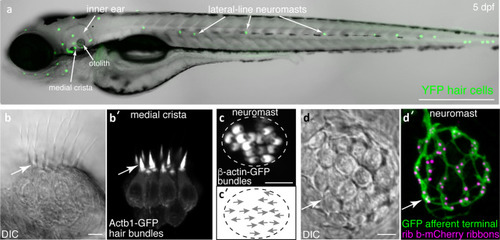
Visualization of structures in hair cell systems of larval zebrafish. (a) A zebrafish larva at 5 days post fertilization (dpf) is shown. At this stage, both the inner ear and lateral line hair cell systems are functional. In this transgenic larvae, all hair cells are visualized via YFP fluorescence (Tg[myo6b:D3cpv]vo9 (Kindt et al. 2012)). (b–b′) High magnification, side-view of hair cells in the medial crista (inner ear). A DIC image (b) and corresponding fluorescence image shows hair cells expressing β-actin-GFP to visualize hair bundles (b′, Tg(myo6b:actb1-EGFP)vo8 (Kindt et al. 2012)). (c–c′) High magnification, top-down image of a neuromast hair cells expressing β-actin-GFP (c′, Tg(myo6b:actb1-EGFP)vo8) can also reveal hair bundle orientations (c′, arrows indicate orientations). (d–d′) DIC image (d) and corresponding fluorescence image shows hair cells expressing Rib b-mCherry to label hair cell ribbons and afferent neurons expressing GFP to label the innervating fiber (d′, Tg(myo6b:ctbp2l-mCherry)idc3; Tg(neurod1:EGFP)nl1 (Sheets et al. 2017; Trapani et al. 2009). The image in a was taken at × 10, while all other images were taken at × 63 magnification. All images were taken at 5 dpf. Scale bar = 500 µm in a and 5 µm in b, c, and d
|
