
Figure 4
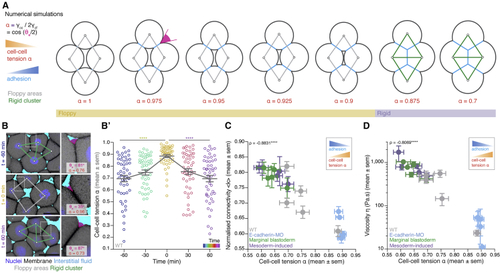
Cell-cell adhesion defines cell connectivity and blastoderm rigidity (A) Numerical simulations of a mechanical toy model for the morphology of a 4-cell rhombus cluster. Increasing cell-cell adhesion (blue) by decreasing cell-cell tension (B) Exemplary high-magnification 2D confocal sections at the 1st–2nd deep-cell layer of the central blastoderm at consecutive time points overlaid with their rigidity profile during the fluidization/thickening process, with close-ups of exemplary contact angle (B’) Dot plot of individual cell-cell tension (C) Plot of normalized connectivity <k> (mean ± SEM) as a function of cell-cell tension (D) Plot of viscosity (mean ± SEM) as a function of cell-cell tension Kruskal-Wallis test (B’), ρ Spearman correlation test (C and D). Scale bars: 20 μm in (B). See also |
Reprinted from Cell, 184(7), Petridou, N.I., Corominas-Murtra, B., Heisenberg, C.P., Hannezo, E., Rigidity percolation uncovers a structural basis for embryonic tissue phase transitions, 1914-1928.e19, Copyright (2021) with permission from Elsevier. Full text @ Cell