Figure Caption
Figure 4
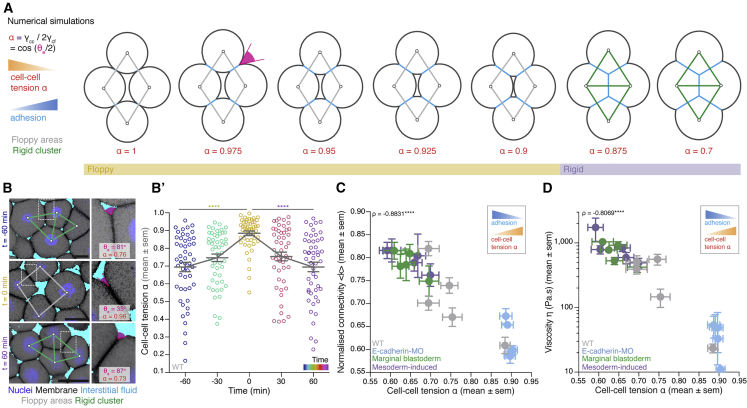
Cell-cell adhesion defines cell connectivity and blastoderm rigidity
(A) Numerical simulations of a mechanical toy model for the morphology of a 4-cell rhombus cluster. Increasing cell-cell adhesion (blue) by decreasing cell-cell tension α (orange) results in contact size expansion and increased connectivity, promoting the emergence of rigid connectivity motifs (green cluster). Contact angle θe (magenta) is used to infer α. Floppy areas are illustrated in gray and rigid areas in green. Yellow- and purple-shaded areas indicate floppy and rigid clusters, respectively (exact values of the α threshold slightly depend on the initial configuration of cells).
(B) Exemplary high-magnification 2D confocal sections at the 1st–2nd deep-cell layer of the central blastoderm at consecutive time points overlaid with their rigidity profile during the fluidization/thickening process, with close-ups of exemplary contact angle θe measurements (right, magenta) and calculated cell-cell tension α. Interstitial fluid is marked by dextran, nuclei by H2B-GFP, and membranes by membrane-RFP. Floppy areas are illustrated in gray and rigid areas in green.
(B’) Dot plot of individual cell-cell tension α measurements in the central blastoderm obtained from the experiments shown in (B) overlaid with a line plot of the mean ± SEM as a function of time (color coded) (n = 50 cell-cell contacts, N = 4 embryos per time point).
(C) Plot of normalized connectivity <k> (mean ± SEM) as a function of cell-cell tension α (mean ± SEM) for several experimental conditions during the fluidization/thickening process (for connectivity: central blastoderm of WT n = 55, N = 11; e-cadherin-MO n = 30, N = 6; mesoderm-induced n = 15, N = 3; marginal blastoderm n = 15, N = 3; n, number of blastoderms, N, number of embryos; for cell-cell tension α: n = 50 cell contacts, N = 4 embryos each data point).
(D) Plot of viscosity (mean ± SEM) as a function of cell-cell tension α (mean ± SEM) for the experimental conditions described in (C) during the fluidization/thickening process (for cell-cell tension α: n = 50 cell contacts, N = 4 embryos each data point; for viscosity: central blastoderm of WT n = 53, N = 11; e-cadherin-MO n = 54, N = 6; mesoderm-induced n = 42, N = 6; marginal blastoderms of WT n = 115, N = 9; n, number of embryos; N, number of embryo batches).
Kruskal-Wallis test (B’), ρ Spearman correlation test (C and D). Scale bars: 20 μm in (B).
See also Figure S4.
Acknowledgments
This image is the copyrighted work of the attributed author or publisher, and
ZFIN has permission only to display this image to its users.
Additional permissions should be obtained from the applicable author or publisher of the image.
Reprinted from Cell, 184(7), Petridou, N.I., Corominas-Murtra, B., Heisenberg, C.P., Hannezo, E., Rigidity percolation uncovers a structural basis for embryonic tissue phase transitions, 1914-1928.e19, Copyright
(2021) with permission from Elsevier.
Full text @ Cell