
FIGURE
Figure 5—figure supplement 1.
- ID
- ZDB-FIG-210414-49
- Publication
- Pronobis et al., 2021 - In vivo proximity labeling identifies cardiomyocyte protein networks during zebrafish heart regeneration
- Other Figures
-
- Figure 1
- Figure 1—figure supplement 1.
- Figure 1—figure supplement 2.
- Figure 2
- Figure 2—figure supplement 1.
- Figure 2—figure supplement 2.
- Figure 2—figure supplement 3.
- Figure 2—figure supplement 4.
- Figure 3
- Figure 3—figure supplement 1.
- Figure 3—figure supplement 2.
- Figure 4
- Figure 4—figure supplement 1.
- Figure 5
- Figure 5—figure supplement 1.
- All Figure Page
- Back to All Figure Page
Figure 5—figure supplement 1.
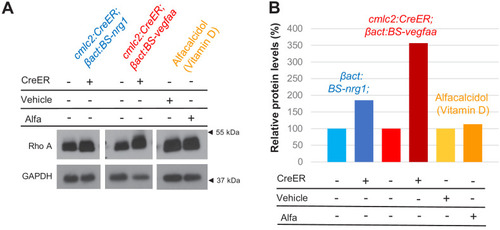
(A) Western blot analysis of Rho A levels in ventricles of zebrafish with Nrg1-overexpression (OE), Vegfaa-OE, or vitamin D receptor activation via alfacalcidol. (B) Quantification of western blot shown in (A). In untreated hearts, Rho A levels were set to 100%. Levels were normalized to loading control GAPDH. |
Expression Data
Expression Detail
Antibody Labeling
Phenotype Data
Phenotype Detail
Acknowledgments
This image is the copyrighted work of the attributed author or publisher, and
ZFIN has permission only to display this image to its users.
Additional permissions should be obtained from the applicable author or publisher of the image.
Full text @ Elife