|
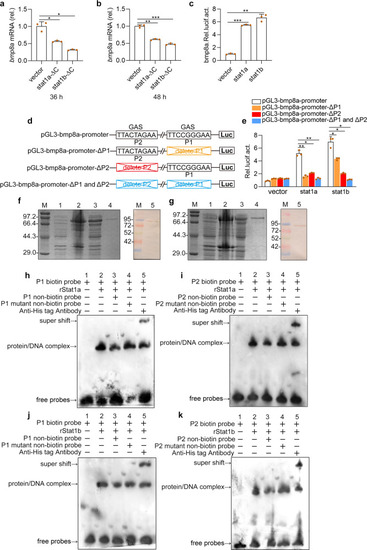
Stat1 binds the GAS sites and activates the <italic>bmp8a</italic> transcriptions upon virus stimulation.a, b Expression of bmp8a mRNA in ZFL cells after transfected with stat1a-ΔC or stat1b-ΔC for 36 h (a) or 48 h (b). The expression of actb1 served as a control for the qRT-PCR. c Dual luciferase report assay was used to analyze the transcription abilities of Stat1a and Stat1b in activation of bmp8a in EPC cells. pGl3-bmp8a (200 ng) was transfected into EPC cells together with stat1a (200 ng), stat1b (200 ng), or empty vector (200 ng). After 48 h, the transfected cells were collected for luciferase assays. d Schematic drawing of wild-type and GAS motif mutation Luc-report plasmids. e The 200 ng of pGL3-bmp8a-promoter, pGL3-bmp8a-promoter-ΔP1, pGL3-bmp8a-promoter-ΔP2 or pGL3-bmp8a-promoter-ΔP1 and ΔP2 was transfected into EPC cells along with stat1a (200 ng), stat1b (200 ng) or empty vector (200 ng), respectively. After 48 h, the transfected cells were collected for luciferase assays. Renilla luciferase was used as the internal control. f, g SDS-PAGE and Western-blotting analysis of rStat1a (f) and rStat1b (g). Lane M: protein molecular standard; Lane 1: negative control for IPTG induced E. coli (without rStat1a or rStat1b); Lane 2: induced rStat1a or rStat1b (the whole cell lysate); Lane 3: induced rStat1a or rStat1b (the supernatant); Lane 4: purified rStat1a or rStat1b; Lane 5: western blot analysis of the sample in Lane 4. h–k EMSA was performed to validate the interaction of rStat1a or rStat1b with the GAS motif (P1 or P2) in the bmp8a promoter region. Lane 1: negative group; Lane 2: positive group; Lane 3: an excess unlabeled competitor probe; Lane 4: an excess unlabeled competitor probe containing a mutated runt binding site; Lane 5: Super-shift assays were performed by adding antibody against His tag. Data were from three independent experiments and were analyzed by Student’s t-test (two-tailed) for comparison of two groups or one-way ANOVA followed by Games–Howell posthoc tests for comparison of multiple groups. All data were presented as mean ± SD (*p < 0.05, **p < 0.01, and ***p < 0.001).
|