FIGURE

FIGURE 5

ID
ZDB-FIG-210327-83
Publication
Chung et al., 2021 - Development of the CK-MB-1 trastuzumab-resistant HER2-positive breast cancer cell line and xenograft animal models
Other Figures
All Figure Page
Back to All Figure Page
FIGURE 5

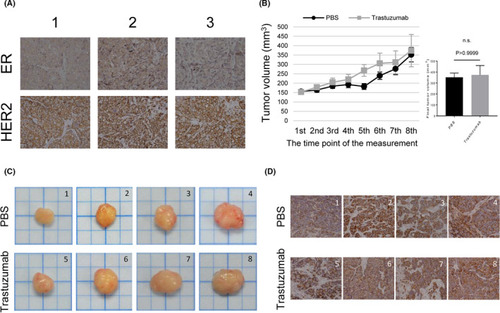
Xenograft mouse models of the CK‐MB‐1 cell line. (A) IHC staining revealed that CK‐MB‐1 xenografts maintained the same ER‐negative/HER2‐positive profile of the parental cell line in the ASID mouse model. (B) NOD‐SCID mice carrying CK‐MB‐1 xenografts were intraperitoneally injected with PBS or trastuzumab (n = four per group). The sizes of xenografts were recorded and plotted according to the protocol. Each plot was the mean of xenografts, and error bars represented the SEM. Xenografts were harvested on the next day after the eighth injection. The final tumor volume of two treatment groups was statistically analyzed using the Mann–Whitney U test. P values less than 0.05 were considered statistically significant. (C) Harvested xenografts were photographed and arranged in the order of final tumor size in each treatment group. (D) HER2 staining remained positive regardless of treatment in every xenograft harvested from NOD‐SCID mice. ER, estrogen receptor; HER2, human epidermal growth factor receptor 2; IHC, immunohistochemical; n.s., not significant; PBS, phosphate‐buffered saline; SEM, standard error of the mean

Expression Data

Expression Detail
Antibody Labeling
Phenotype Data

Phenotype Detail
Acknowledgments
This image is the copyrighted work of the attributed author or publisher, and ZFIN has permission only to display this image to its users. Additional permissions should be obtained from the applicable author or publisher of the image. Full text @ Cancer Med