FIGURE

Figure 5

ID
ZDB-FIG-210327-66
Publication
Ogawa et al., 2021 - Sexual Dimorphic Distribution of Hypothalamic Tachykinin1 Cells and Their Innervations to GnRH Neurons in the Zebrafish
Other Figures
All Figure Page
Back to All Figure Page
Figure 5

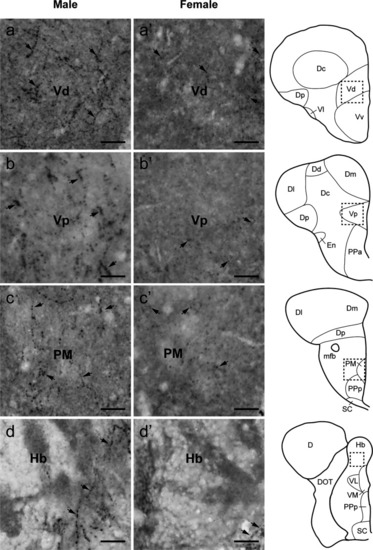
Sexual dimorphisms in Tac1-immunoreactive processes in the telencephalic and diencephalic regions. Left (A−D) and middle (A’−D’) columns represent photomicrographs of Tac1-immunoreactive processes (arrows) in the brain of males and females, respectively. Boxes with a dotted line in the schematic drawing of coronal view in the right column indicate the localization of the boundaries of the respective immunohistochemical illustrations. In the ventral part of the ventral telencephalon, more Tac1-immunoreactive processes are seen in male brains (A−C) as compared to females (A’−C’). Similarly, more Tac1-immunoreactive processes are observed in the habenula nuclei in males as compared to female (D, D’). Scale bars: 20 µm. See Glossary for abbreviation.

Expression Data
Gene:
Antibody:
Fish:
Anatomical Terms:
Stage: Adult

Expression Detail
Antibody Labeling
Phenotype Data

Phenotype Detail
Acknowledgments
This image is the copyrighted work of the attributed author or publisher, and ZFIN has permission only to display this image to its users. Additional permissions should be obtained from the applicable author or publisher of the image. Full text @ Front Endocrinol (Lausanne)