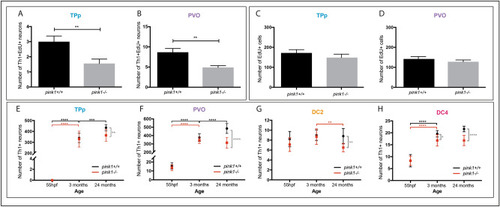
Adult generation of DA neurons is impeded in pink1-/- zebrafish. (A,B) Quantification of the number of newly generated Th1+EdU+ DA neurons in pink1+/+ and pink1-/- zebrafish shows a significant reduction in the TPp (A) (t-test, p = 0.0078, n = 9 for each) and in the PVO (B) (t-test, p = 0.0017, n = 9 fish for each) of 3 month pink1-/- zebrafish compared to pink1 + / + siblings. (C,D) No difference in the total number of EdU+ cells in the TPp (C) (t-test, p = 0.3431, n = 9 fish for each) and in the PVO (D) (t-test, p = 0.3640, n = 9 fish for each) in 3 month pink1-/- zebrafish compared to pink1+/+ siblings. (E) Quantification of DA neurons in the TPp shows an increase in the number of DA neurons in pink1+/+ zebrafish (black line) between 55hpf and 3 months (two-way ANOVA, p = < 0.001, n = 10 fish for each) and between 3- and 24 months (two-way ANOVA, p = 0.0001, n = 10 fish for each). In pink1-/- zebrafish, the number of DA neurons increases between 55hpf and 3 months (two-way ANOVA, p = < 0.001, n = 10 fish for each), but not between 3- and 24 months (two-way ANOVA, p = 0.4587, n = 10 fish for each). pink1-/- zebrafish (red line) have significantly fewer DA neurons in the TPp at 24 months (two-way ANOVA, p = 0.0065, n = 10 fish for each) but not at 55hpf (two-way ANOVA, p = > 0.9999, n = 10 fish for each) or at 3 months (two-way ANOVA, p = 0.9917, n = 10 fish for each). (F) Quantification of DA neurons in the PVO shows in pink1+/+ zebrafish (black line), the number of DA neurons significantly increases between 55hpf and 3 months (two-way ANOVA, p = < 0.0001, n = 10 fish for each) and between 3 and 24 months (two-way ANOVA, p = < 0.0001, n = 10 fish for each). In pink1-/- zebrafish (red line), the number of DA neurons significantly increases between 55hpf and 3 months (two-way ANOVA, p = < 0.0001, n = 10 fish for each) but not between 3 and 24 months. pink1-/- zebrafish have significantly fewer DA neurons than pink1+/+ zebrafish in the PVO at 24 months of age (two-way ANOVA, p = < 0.0001, n = 10 fish for each) fish fish fish fish fish fish fish fish fish fish fish eachfish eachfish eachfish each(G) Quantification of DA neurons in the DC2 population shows pink1+/+ zebrafish (black line), the number of DA neurons does not significantly increase between 55hpf and 3 months, or between 3 and 24 months. In pink1-/- zebrafish (red line), the number of DA neurons does not significantly increase between 55hpf and 3 months, but significantly decreases between 3 and 24 months (two-way ANOVA, p = 0.0077, n = 10 fish for each). pink1-/- zebrafish have significantly fewer DA neurons than pink1 + / + zebrafish in the TPp at 2-years of age (two-way ANOVA, p = 0.0065, n = 10 fish for each). (H) Quantification of DA neurons in the DC4 population shows in pink1+/+ zebrafish (black line), the number of DA neurons significantly increases between 55hpf and 3 months (two-way ANOVA, p = < 0.0001, n = 10 fish for each) but not between 3 and 24 months. In pink1-/- zebrafish (red line), the number of DA neurons significantly increases between 55hpf and 3 months (two-way ANOVA, p = < 0.0001, n = 10 fish for each) but not between 3 and 24 months. pink1-/- zebrafish have significantly fewer DA neurons than pink1+/+ zebrafish in the PVO at 3 months (two-way ANOVA, p = 0.0308, n = 10 fish for each) and even more so at 24 months of age (two-way ANOVA, p = < 0.0001, n = 10 fish for each).
|
