
Figure 6
- ID
- ZDB-FIG-210325-37
- Publication
- Guo et al., 2021 - Trio cooperates with Myh9 to regulate neural crest-derived craniofacial development
- Other Figures
- All Figure Page
- Back to All Figure Page
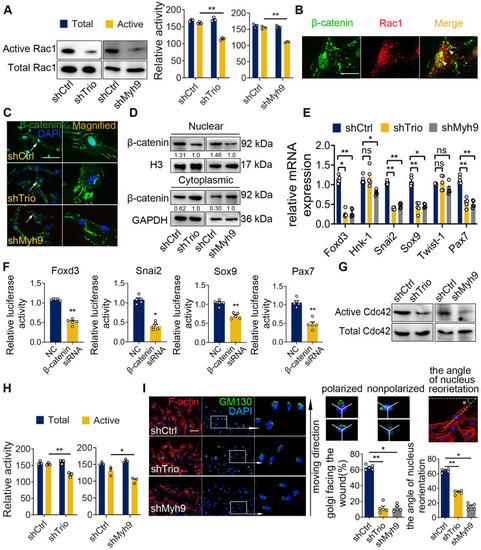
Myh9 assists Trio in the regulation of NCC migration via Rac1 and Cdc42 GTPase activation. (A) Rac1 pull-down activation in the shCtrl, shTrio, and shMyh9 NCC groups, with quantification (n = 3). (B) Immunostaining of β-catenin (green) and Rac1 (red) in NCCs. Bar = 100 μm. (C) Immunostaining of β-catenin (green) and DAPI (blue) for nuclear β-catenin expression indicated by a white arrow in shTrio and shMyh9 NCCs. Bar = 100 μm. (D) Western blot of β-catenin in the nucleus and cytoplasm in the shTrio and shMyh9 NCC groups. (E) qRT-PCR of migratory NCC marker genes (Foxd3, Hnk-1, Snai2, Sox9, Twist-1, Pax7) expression (n = 5). (F) Dual-luciferase reporter assay of relative NCC marker genes (Foxd3, Snai2, Sox9, Pax7) influenced by β-catenin (n = 5). (G and H) Cdc42 pull-down activation assay in the shTrio and shMyh9 NCC groups, with quantification (n = 3). (I) Immunofluorescence staining of the Golgi body marker GM130 and F-actin for polarization assay. The nuclei were counterstained with DAPI. The following schematic shows a polarized and nonpolarized cell, as well as the angle of nucleus reorientation. Bar = 100 μm. The quantification is shown as the percentage of Golgi facing the wound and the angle of nucleus reorientation (n = 5). For (A), (E), (F), (H), and (I), data are represented as mean ± S.E.M. (two-tailed t test *p < 0.05, **p < 0.01). |