
Figure 3
- ID
- ZDB-FIG-210325-34
- Publication
- Guo et al., 2021 - Trio cooperates with Myh9 to regulate neural crest-derived craniofacial development
- Other Figures
- All Figure Page
- Back to All Figure Page
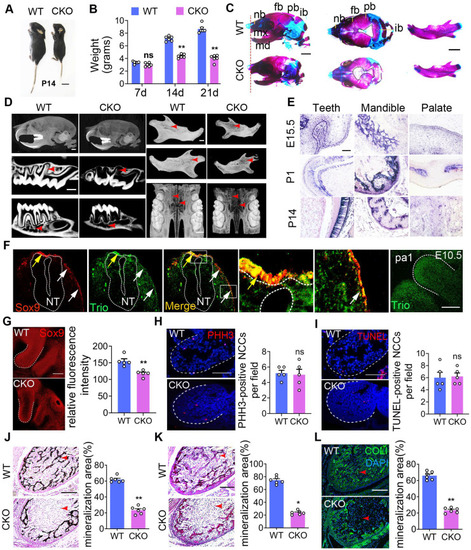
Mice with Trio-deficient NCC-derived tissues show craniofacial defects. Photograph of Triofl/fl (WT) and Wnt1-cre;Triofl/fl (CKO) mice at P14. The CKO image is representative of the smaller body size (see quantification in Figure S2B). Bar = 1 cm. P14, postnatal day 14. (B) Quantitative analysis of WT and CKO mouse weights at P7, P14, and P21 (n = 6). (C) WT and CKO mouse skulls and mandibles stained with Alizarin red and Alcian blue at P1. Bar = 500 μm. (D) Micro-CT image of the skull, teeth, mandible, and palate at P21. CKO mice display a significant reduction in mineralization (red arrowhead) of the skull, teeth, mandible, and palate. Bar = 500 μm. (E) WISH was performed for Trio expression in teeth, mandible, and palate at E15.5, P1, and P14. Blue-violet staining represents Trio anti-sense probe staining. Bar = 50 μm. (F) Immunofluorescence of Trio and Sox9 on sagittal sections of WT mouse embryos at E10.5. The colocalization (yellow) region demonstrates recombination in the premigratory (yellow arrow) and migratory (white arrow) NCC. Magnified images of the white dotted frame are attached to the right. NT: neural tube. The Far-right immunofluorescence of image is the sagittal section of WT mouse, which represents the primary expression of Trio in the pa1. Bar = 50 μm. (G) Immunofluorescence staining of Sox9 for cell migration in E9.5 CKO and WT embryos, with quantitative analysis (n = 5). Bar = 50 μm. (H) Immunofluorescence staining of PHH3 (red) for cell proliferation in sagittal sections through pa1 in E10.5 WT and CKO embryos. Bar = 50 μm. (I) Immunofluorescence staining with TUNEL assay (red) for cell death in sagittal sections through pa1 in E10.5 WT and CKO embryos. Bar = 50 μm. (J-L) Von Kossa (J), total collagen (K), and Collagen I (L) histologic staining of the mandible at P1, with quantification (n = 6). Red arrowhead: mineralization area. Bar = 100 μm. COL I, Collagen I. For (B), (G) - (L), data are represented as mean ± S.E.M. (two-tailed t test *p < 0.05, **p < 0.01, ns, not significant). |