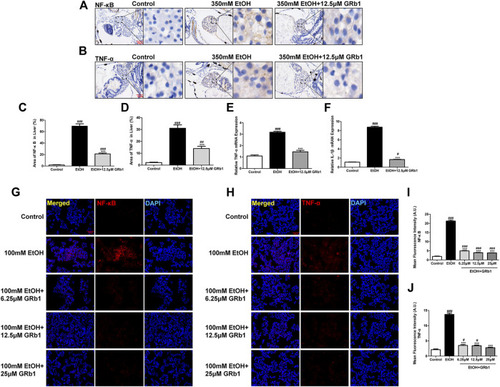
GRb1 downregulates the expression of proinflammatory cytokines. (A) NF-κB immunohistochemical staining of zebrafish larvae. Figures are magnified as 400ⅹ. (B) TNF-α immunohistochemical staining of zebrafish larvae. Figures are magnified as 400ⅹ. (C) Statistical analysis of the area of NF-κB expression in the liver of zebrafish larvae using ImageJ software (n = 6–8 per group). (D) Statistical analysis of the area of TNF-α expression in the liver of zebrafish larvae using ImageJ software (n = 6–8 per group). (E) and (F) Real-time PCR analysis of the mRNA levels of TNF-α and NF-κB in zebrafish larvae. The mRNA levels were normalized to β-actin mRNA levels and presented as fold change compared with the control group (n = 3 per group). (G) NF-κB immunofluorescence staining of L-O2 cells slides. Figures are magnified as 200ⅹ. (H) TNF-α immunofluorescence staining of L-O2 cell slides. Figures are magnified as 200ⅹ. (I) Quantitative analysis of NF-κB levels in L-O2 cells according to mean fluorescence intensity using ImageJ software. (J) Quantitative analysis of TNF-α levels in L-O2 cell according to mean fluorescence intensity using ImageJ software. Data are presented as the mean ± SEM. p < 0.05 (#), p < 0.01 (##), and p < 0.001 (###) compared with the control group; p < 0.05 (*), p < 0.01 (**), and p < 0.001 (***) compared with the 350 mM EtOH group or 100 mM EtOH group.
|
