
Figure 7
- ID
- ZDB-FIG-210218-51
- Publication
- Adikes et al., 2020 - Visualizing the metazoan proliferation-quiescence decision in vivo
- Other Figures
-
- Figure 1
- Figure 1—figure supplement 1.
- Figure 2
- Figure 2—figure supplement 1.
- Figure 3
- Figure 3—figure supplement 1.
- Figure 4
- Figure 4—figure supplement 1.
- Figure 5
- Figure 5—figure supplement 1.
- Figure 6
- Figure 6—figure supplement 1.
- Figure 7
- Figure 7—figure supplement 1.
- Figure 8—figure supplement 1.
- Figure 8—figure supplement 1.
- All Figure Page
- Back to All Figure Page
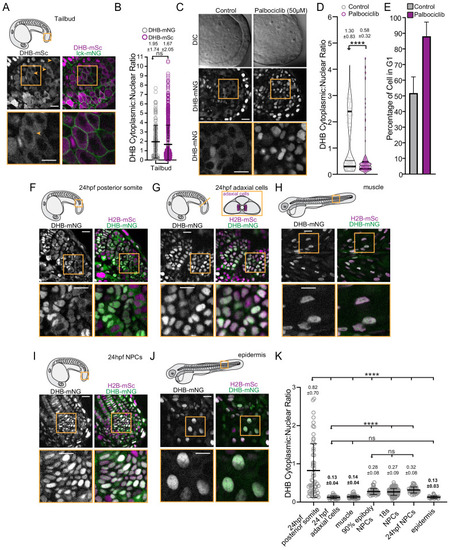
(A) Representative micrographs of CDK sensor (orange arrows and box inset highlights cytosolic CDK sensor localization) and quantification of DHB ratio (B) in the tailbud (n ≥ 160 cells). (C) Representative images of the tailbud of control or 50 µM palbociclib treated embryos (n ≥ 3 embryos). (D) Quantification of DHB in the tailbud (posterior wall and notochord cells excluded) of control or 50 µM palbociclib treated embryos at 20–22 somite stage. (E) Percentage of cells in G1 in the tailbud (posterior wall and notochord cells excluded) of control or 50 µM palbociclib treated embryos. (F–J) Representative micrographs of cells of 24 hpf posterior somites (F; n ≥ 59 cells), adaxial cells (G; n ≥ 50 cells), differentiated muscle at 72 hpf (H; n ≥ 101 cells), notochord progenitors (NPCs) (I; n ≥ 48 cells), and epidermis at 72 hpf (J; n ≥ 32 cells). Insets, orange box, are zoom-ins. Scale bar = 20 μm. (K) Quantification of DHB ratios in zebrafish tissues. Line and error bars depict mean ± SD. ns, not significant, ****p≤0.0001. Orange boxes in schematics (A, F, G and H) depict region shown by the corresponding micrographs in each representative panel. In panel G, a schematic of a transverse section illustrating the position of adaxial cells is shown, but the micrograph is a lateral view. Significance determined by statistical simulations; p-values in Supplementary file 1. |