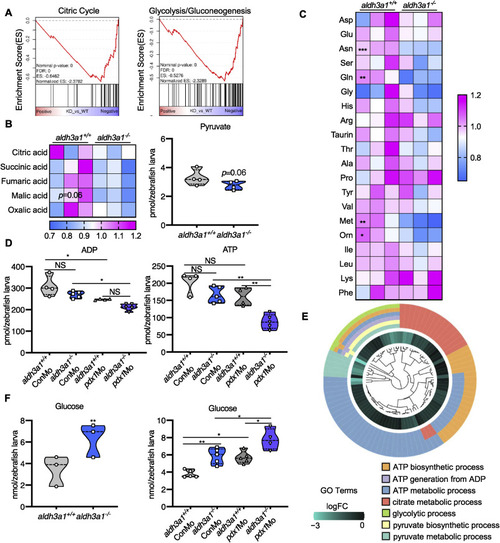
Fig. 7. Aldh3a1 knockout zebrafish larvae exhibited impaired glucose homeostasis and can be further aggravated by endogenous pdx1 expression silencing. (A). RNA-Seq GSEA analysis showed down-regulated expression of Citric Cycle and Glycolysis/Gluconeogenesis at 48 hpf; And (B) the intermediates of Citric Cycle and pyruvate showed a decreased trend at 96 hpf in aldh3a1−/− zebrafish larvae. (C). Amino acid profile displayed several reduced glycogenic amino acids, including Asn, Gln and Met in aldh3a1−/− larvae at 96 hpf. (D) ADP and ATP showed decreased levels in aldh3a1−/− larvae and achieved significantly lowest ATP and ADP levels with pdx1 silencing at 96hpf; (E). All these metabolomic changes were further confirmed via RNA-Seq GO pathway enrichment analysis, and all core genes showed down-regulated logFC value in the involved seven pathways. (F). Increased glucose level was determined in aldh3a1−/− larvae at 48 hpf, while pdx1 silencing enhanced the impaired glucose homeostasis. 6 ng of each morpholino was injected into the one-cell stage of zebrafish embryos respectively. n = 3–6 as each violin plot or heatmap showed. For statistical analysis, paired samples t-tests or one-way ANOVA followed by Sidak's multiple comparison test was applied, *p < 0.05, **p < 0.01, ***p < 0.001. Asn, asparagine; Gln, glycine; Met, methionine.
|
