
Fig. 4
- ID
- ZDB-FIG-210209-4
- Publication
- Triplett et al., 2020 - Model-based decoupling of evoked and spontaneous neural activity in calcium imaging data
- Other Figures
- All Figure Page
- Back to All Figure Page
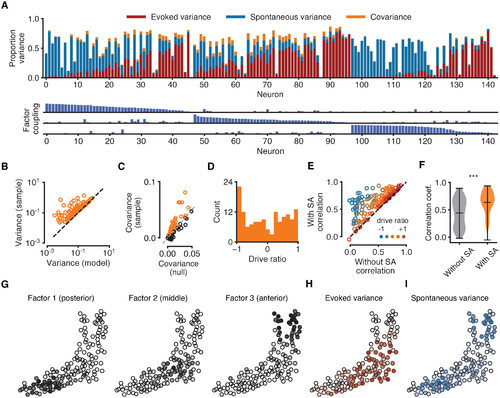
Fig 4. Analysis of the contribution of EA and SA to neural variability. All data for the same fish as in Fig 3. (A) Top: composition of each neuron’s sample variance in terms of variance attributable solely to EA (red bars), solely to shared SA (blue bars), and their covariance (orange bars). Orange bars represent absolute values of covariances for ease of visualisation. Variance components are given as proportions of the total sample variance of the raw fluorescence signal var[fn] (corrected for imaging noise, see Methods). Neurons sorted by the strength of their coupling to each factor (as in Fig 3E). Bottom: coupling between neurons and latent sources of SA suggests neurons with strong coupling are weakly driven by sensory stimuli. Maximum bar height of one. (B) Sample variance (corrected for imaging noise) vs variance of the statistical model indicates that the model does not overestimate variance. Each data point represents one neuron. (C) Covariances between evoked and spontaneous traces estimated by the model (vertical axis). Chance levels for a null model (horizontal axis) are 95th percentiles of shuffled data obtained by cyclically permuting evoked traces by random offsets 1000 times while preserving temporal structure. Sample covariances exceeding chance levels (orange circles above dashed identity line) cannot be attributed to the slow timescale of the calcium indicator. (D) Distribution of drive ratios across the population of neurons. (E) Correlation coefficient between raw fluorescence trace and evoked component of model fit (without SA) and full model fit (with SA). Neurons with strongly negative drive ratios show marked improvement in the quality of model fit. (F) Violin plots showing statistically significant improvement in the average correlation coefficient between experimental data and model fits after incorporating latent sources of SA (p < 0.001, Wilcoxon signed-rank test). (G) Spatial organisation of latent factors underlying SA. The three non-overlapping factors are spatially localised and tile the imaging plane. (H) Spatial organisation of the evoked variance components. Cell opacity is proportional to the fraction of variance attributable to EA for the given neuron. Neurons strongly driven by EA cluster in the middle region of the tectum. (I) Same as H, but for SA. Neurons strongly driven by SA cluster in the anterior and posterior tectum. |