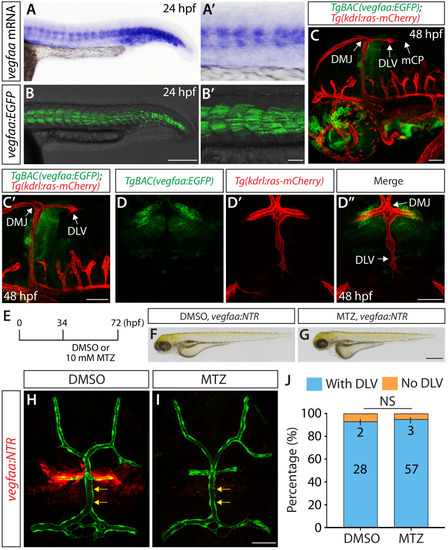
Figure 8.

Expression patterns of <italic>vegfaa</italic> and its requirement for mCP vascular formation.

(A–B’) Lateral views of endogenous vegfaa mRNA expression patterns detected by in situ hybridization at 24 hpf (A and A’). Lateral views of the EGFP expression patterns driven by the Tg(UAS:EGFP) embryo carrying the TgBAC(vegfaa:gal4ff) transgene (B and B’). The EGFP expression domains closely matched the endogenous vegfaa mRNA expression patterns. (C, C’ and D–D") Lateral (C and C’) and dorsal (D–D") views of 48 hpf TgBAC(vegfaa:EGFP);Tg(kdrl:ras-mCherry) embryos, showing the TgBAC(vegfaa:EGFP) expression in the cells located ventrally to the DLV. TgBAC(vegfaa:EGFP) expression was not observed in the extending DLV or in the dorsal surfaces of the brain meninges. (E) Time course of the cell ablation experiments for panels (F–J). (F and G) Brightfield images of 72 hpf TgBAC(vegfaa:NTR) larvae after treatment with DMSO (F) or 10 mM MTZ (G) from 34 to 72 hpf. (H and I) Dorsal views of 72 hpf TgBAC(vegfaa:NTR) cranial vasculature visualized by Tg(kdrl:EGFP) expression after treatment with DMSO (H) or MTZ (I) from 34 to 72 hpf. Efficient ablation of NTR-mCherry+ cells was observed after treatment with MTZ (I) compared to the DMSO-treated control (H). MTZ-treated TgBAC(vegfaa:NTR) larvae formed the DLV (yellow arrows) and PCeV. (J) Percentage of the 72 hpf transgenic fish with and without the DLV after treatment with DMSO or MTZ. No significant difference was observed between MTZ-treated (n = 60) and DMSO-treated (n = 30) groups. Scale bars: 1 mm in (G); 200 μm in (B); 100 μm in (B’); 50 μm in (C), (C’), (D’ and I).

Expression Data

Expression Detail
Antibody Labeling
Phenotype Data

Phenotype Detail
Acknowledgments
This image is the copyrighted work of the attributed author or publisher, and ZFIN has permission only to display this image to its users. Additional permissions should be obtained from the applicable author or publisher of the image. Full text @ Elife