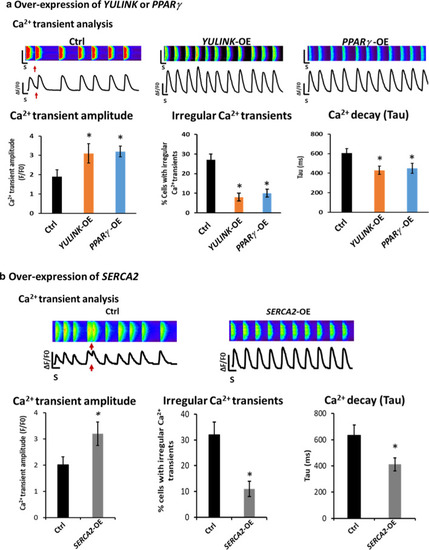
Over-expression of YULINK, PPARγ and SERCA2 rescued the phenotypes of mouse Yulink KD HL-1 cardiomyocytes. Control (Ctrl), YULINK, PPARγ or SERCA2 plasmids (carrying BFP as indicator of expression marker) were transfected or electroporated into Yulink KD cells, and then analyzed for Ca2+ cycling using fluorescent Ca2+ dye, Rhod-2 AM. a Over-expression of YULINK or PPARγ. Representative line-scan images and spontaneous Ca2+ transient in Yulink KD mouse HL-1 cardiomyocytes. Arrhythmia-like waveforms were observed in Yulink KD cardiomyocytes with Ctrl vector (red arrows). After over-expression of YULINK (YULINK-OE) or PPARγ (PPARγ-OE) in Yulink KD cells, normal waveforms were observed. The result of Ca2+ spark analysis was consistent with the increase of Ca2+ transient amplitudes (3.1 ± 0.5 for YULINK-OE or 3.2 ± 0.3 for PPARγ-OE, vs. 1.9 ± 0.35 for Ctrl). The cells with YULINK or PPARγ over-expression also exhibited a decrease of the percentages of irregular Ca2+ transients (8 ± 2% for YULINK-OE or 10 ± 2% for PPARγ-OE, vs. 27 ± 3% for Ctrl). The cells with YULINK or PPARγ over-expression also exhibited a reduction of the Ca2+ decay (Tau) rate (430 ± 42 ms for YULINK-OE or 450 ± 51 ms for PPARγ-OE, vs. 605 ± 47 ms for Ctrl). Ctrl (black bars), YULINK-OE (orange bars) and PPARγ-OE (blue bars) (n = 40, each). *p < 0.05, Student’s t test. b Over-expression of SERCA2. Representative line-scan images and spontaneous Ca2+ transients in Yulink KD mouse HL-1 cardiomyocytes. Arrhythmia-like waveforms were observed in Yulink KD cardiomyocytes with control vector (Ctrl, red arrows). After over-expression of SERCA2 (SERCA2-OE) in Yulink KD cells, normal waveforms were observed. The result of Ca2+ spark analysis was consistent with the increase of Ca2+ transient amplitudes (3.2 ± 0.45 for SERCA2-OE vs. 2.02 ± 0.3 for Ctrl). The cells with SERCA2-OE also exhibited a decrease of the percentages of irregular Ca2+ transients (11 ± 3% for SERCA2-OE vs. 32 ± 5% for Ctrl). The cells with SERCA2-OE also exhibited a reduction of the Ca2+ decay (Tau) rate (412 ± 50 ms for SERCA2-OE vs. 635 ± 78 ms for Ctrl). Ctrl vector (black bars), SERCA2-OE (gray bars) (n = 35, each). *p < 0.05, Student’s t test
|
