
Fig. 4
- ID
- ZDB-IMAGE-210117-31
- Publication
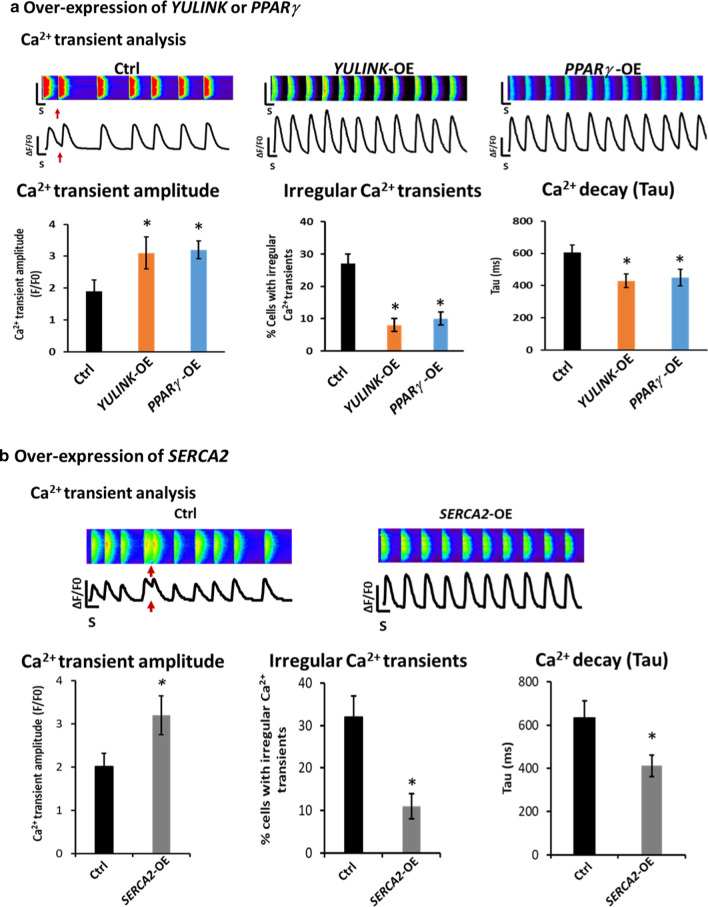
- Kuo et al., 2021 - Yulink, predicted from evolutionary analysis, is involved in cardiac function
- All Figures
- Figures for Kuo et al., 2021
|
Fig. 4
Over-expression of