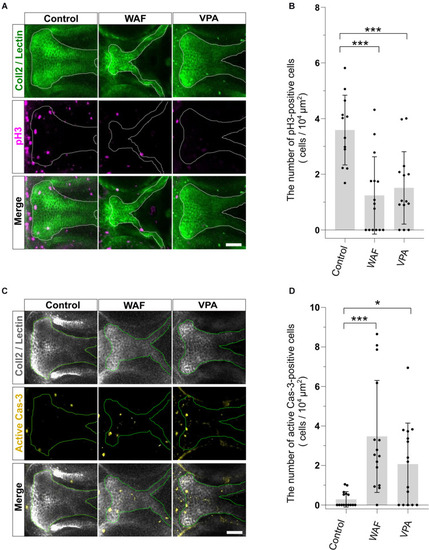
The pattern of proliferation and apoptosis in the cleft palate induced by teratogens. (A) Immunofluorescence images of proliferative cells in the palate at 96 hpf. Embryos were treated with WAF (30 μM) or VPA (20 μM) and stained with anti-coll2 antibody, lectin PNA and anti-phospho-histone H3 (pH3) antibody. Green indicates cartilage cells double stained with anti-coll2 antibody and lectin PNA. White dotted lines trace the shape of the palate. Magenta indicates proliferative cells stained with anti-pH3 antibody. (B) The number of pH3-positive cells in the palate. Numerical value is normalized by 104 μm2. n = 12 (Control), 15 (WAF), 14 (VPA), ***P < 0.001 (one-way ANOVA followed by Dunnett’s multiple comparison test). (C) Immunofluorescence images of apoptotic cells in the palate at 96 hpf. Embryos were treated with WAF (30 μM) or VPA (20 μM) and stained with anti-coll2, lectin PNA anti-active caspase 3 (active Cas-3) antibody. White indicates cartilage cells double stained with anti-coll2 antibody and lectin PNA. Green dotted lines trace the shape of ethmoid plate. Yellow indicates apoptotic cells stained with anti-caspase3 antibody. (D) The number of active caspase3-positive cells in the palate. Numerical value was normalized to 104 μm2. n = 15 (Control), 15 (WAF), 15 (VPA), *P < 0.05, ***P < 0.001 (one-way ANOVA followed by Dunnett’s multiple comparison test). Scale bars: 50 μm.
|
