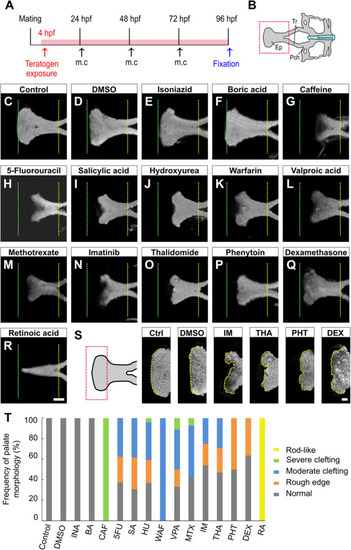
Morphological phenotype of chemical-induced cleft palate in zebrafish embryos. (A) Experimental time course m.c.: medium change. (B) Atlas of the neurocranial cartilage. Ep, Ethmoid plate; Tr, Trabecula; Pch, Parachordal. (C–R) Fluorescence images of the ethmoid palate (zebrafish palate) at 96 hpf. Nuclei of cartilage cells were stained with DAPI. The anterior and posterior edges of the palate are indicated by green and yellow dotted lines, respectively. Exposure concentration was as follows: DMSO as vehicle control (0.1%), isoniazid (INA, 1 mM), boric acid (BA, 1 mM), caffeine (CAF, 1 mM), 5-fluorouracil (5FU, 1 mM), salicylic acid, (SA, 200 μM), hydroxyurea (HU, 1 mM), warfarin (WAF, 30 μM), valproic acid (VPA, 15 μM), methotrexate (MTX, 200 μM), imatinib (IM, 250 μM), thalidomide (THA, 400 μM), phenytoin (PHT, 1 mM), dexamethasone (DEX, 1 mM), and retinoic acid (RA, 10 nM). (S) Highly magnified images of the anterior edge of the palate. Ctrl, control; IM, imatinib; THA, thalidomide; PHT, phenytoin; DEX, dexamethasone. Yellow dotted line traces the shape of anterior edge. (T) Frequency of palate morphology. n = 19 (Control), 18 (DMSO), 11 (INA), 14 (BA), 17 (CAF), 8 (5FU), 16 (SA), 27 (HU), 11 (WAF), 18 (VPA), 14 (MTX), 24 (IM), 17 (THA), 10 (PHT), 22 (DEX), 16 (RA). Scale bars: 50 μm in (C–R), 20 μm in (S).
|
