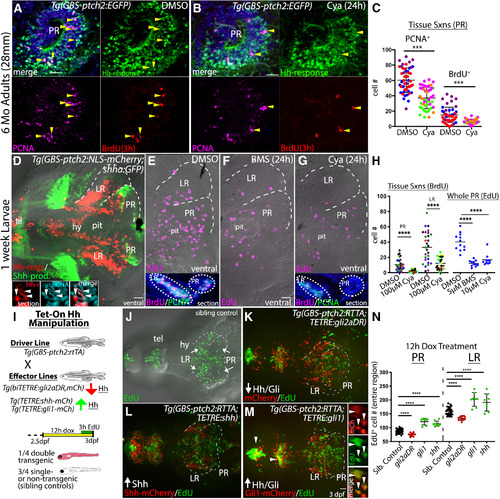
Hh signaling positively regulates proliferation in the adult and larval hypothalamus. A, Sagittal section through the PR of a DMSO (control)-injected Tg(GBS-ptch2:EGFP) transgenic adult brain showing anti-PCNA (magenta)-labeled and BrdU (red, 3-h exposure)-labeled proliferative cells. Arrowheads mark triple-labeled, proliferative, Hh-responsive cells. B, Sagittal section through the PR of a Tg(GBS-ptch2:EGFP) transgenic adult brain 24 h after injection of the Hh/Smo inhibitor Cya (80 μm) showing anti-PCNA (magenta)-labeled and BrdU (red)-labeled proliferative cells. Arrowheads mark triple-labeled cells. C, Quantification of BrdU-labeled and PCNA-labeled cells in control and Cya-injected adults. Each dot represents the number of cells counted in a single tissue section, with each color representing a different adult fish (n = 3 fish, 10–11 sections per fish). D, Ventral view of a dissected Tg(GBS-ptch2:NLS-mCherry;shha:GFP) double transgenic larval brain showing Hh-responsive (red) and Shh-producing (green) cells. The hypothalamic lobes surrounding the PR and LR of the third ventricle are outlined on one side of the brain. Insets show PCNA-labeled (cyan) Hh-responsive cells (red) in sagittal sections through the PR of a different larval brain, with examples of double-labeled cells marked by arrowheads. E–G, Ventral views of 7-dpf larval brains from fish labeled for 3 h with EdU following incubation in DMSO (control, E), BMS-833923 (BMS, F), or Cya (G) for 24 h. Insets in E, G show representative sagittal tissue sections through the hypothalamus of DMSO (E)-treated and Cya (F)-treated larvae labeled to show BrdU (2-h treatment) and PCNA-labeled proliferative cells. H, Quantification of EdU-labeled, BrdU-labeled, and PCNA-labeled cells in the PR and LR. For tissue sections (left), each color represents a different larval fish (n = 5 controls, n = 6 Cya treated), and each dot represents cells in a single tissue section (five to nine sections per fish). For whole PR EdU counts (right), each dot represents one larva (n = 12 for DMSO, 11 for BMS, and 10 for Cya). I, Schematic showing the Tet-On transgenic system used to manipulate Hh signaling. The Tg(GBS-ptch2:RTTA) line drives expression of the RTTA transcriptional activator in Hh-responsive cells, with different effector transgenes allowing upregulation and downregulation of Hh signaling on the addition of doxycycline, which is required for RTTA function. Activation of the two-part transgenic expression system is indicated by mCherry fluorescence in larvae, as shown in the diagram of the experimental timeline. J–M, Ventral views of EdU-labeled (3-h exposure) proliferative cells in the larval hypothalamus following manipulation of Hh signaling levels using the Tet-On system. J, EdU-labeled proliferative cells (green) in a single-transgenic sibling (control), identified based on the lack of red fluorescence. K, EdU-labeled proliferative cells (green) visualized 12 h after activation of a dominant repressor form of the Gli2 transcription factor (Gli2DR) in Hh-responsive cells (red). L, EdU-labeled proliferative cells (green) visualized following activation of the Shh effector transgene [Tg(TETRE:shha-mCherry)] in Hh-responsive cells [Tg(GBS-ptch2:RTTA) driver]. M, EdU-labeled proliferative cells 12 h after activation of the Gli1-mCherry fusion protein in Hh-responsive cells (red). A subset of EdU-labeled cells was co-labeled with the mCherry protein (arrowheads). Separated EdU, mCherry, and merged channels from the PR of a different brain are shown on the right. N, Quantification of all EdU+ proliferating cells in the PR and LR of the larval hypothalamus following Hh-manipulation using the Tet-On system. Each dot represents an individual fish. Upregulation of Hh/Gli signaling via the shha and gli1 transgenes led to increased proliferation, while downregulation of Hh signaling via the gli2DR transgene reduced proliferation; ***p < 0.001, ****p < 0.0001. Source data for graphs can be found in Extended Data Figure 3-1. Scale bars: 20 μm.
|
