IMAGE

Figure 3.

ID
ZDB-IMAGE-201231-1
Source
Figures for Male et al., 2020
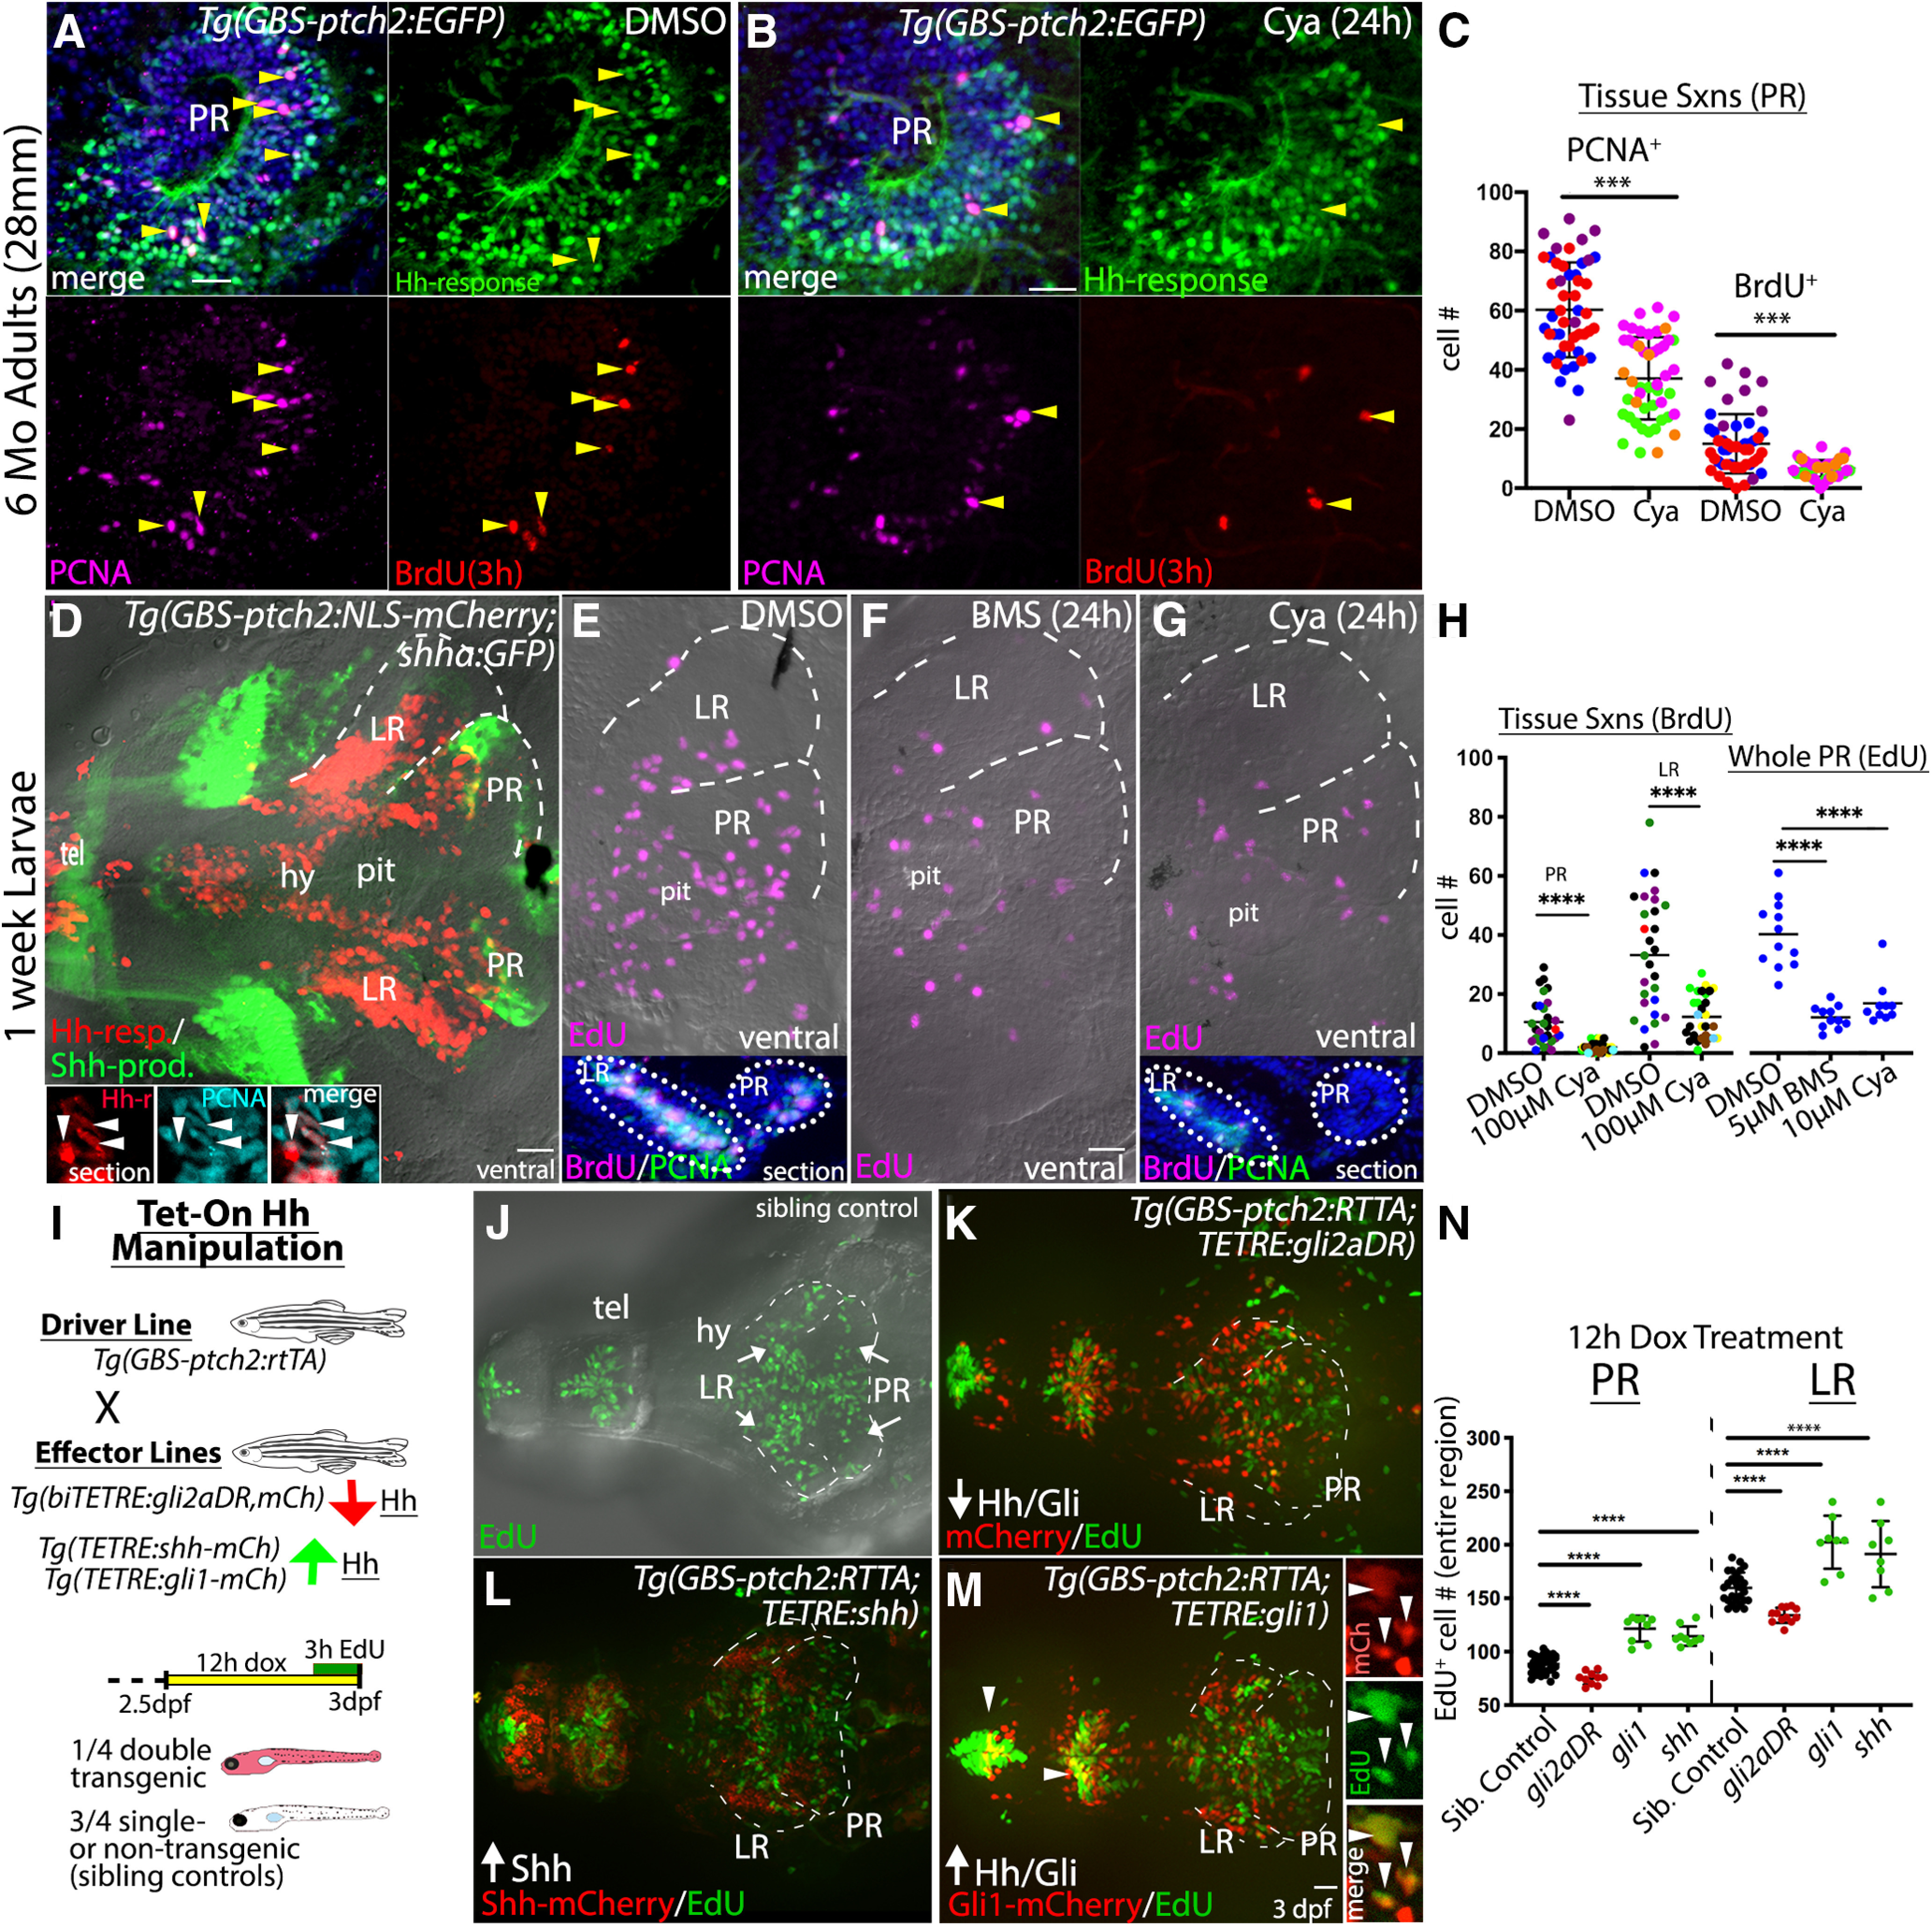
Image
Figure Caption

Figure 3.

Hh signaling positively regulates proliferation in the adult and larval hypothalamus. A, Sagittal section through the PR of a DMSO (control)-injected Tg(GBS-ptch2:EGFP) transgenic adult brain showing anti-PCNA (magenta)-labeled and BrdU (red, 3-h exposure)-labeled proliferative cells. Arrowheads mark triple-labeled, proliferative, Hh-responsive cells. B, Sagittal section through the PR of a Tg(GBS-ptch2:EGFP) transgenic adult brain 24 h after injection of the Hh/Smo inhibitor Cya (80 μm) showing anti-PCNA (magenta)-labeled and BrdU (red)-labeled proliferative cells. Arrowheads mark triple-labeled cells. C, Quantification of BrdU-labeled and PCNA-labeled cells in control and Cya-injected adults. Each dot represents the number of cells counted in a single tissue section, with each color representing a different adult fish (n = 3 fish, 10–11 sections per fish). D, Ventral view of a dissected Tg(GBS-ptch2:NLS-mCherry;shha:GFP) double transgenic larval brain showing Hh-responsive (red) and Shh-producing (green) cells. The hypothalamic lobes surrounding the PR and LR of the third ventricle are outlined on one side of the brain. Insets show PCNA-labeled (cyan) Hh-responsive cells (red) in sagittal sections through the PR of a different larval brain, with examples of double-labeled cells marked by arrowheads. E–G, Ventral views of 7-dpf larval brains from fish labeled for 3 h with EdU following incubation in DMSO (control, E), BMS-833923 (BMS, F), or Cya (G) for 24 h. Insets in E, G show representative sagittal tissue sections through the hypothalamus of DMSO (E)-treated and Cya (F)-treated larvae labeled to show BrdU (2-h treatment) and PCNA-labeled proliferative cells. H, Quantification of EdU-labeled, BrdU-labeled, and PCNA-labeled cells in the PR and LR. For tissue sections (left), each color represents a different larval fish (n = 5 controls, n = 6 Cya treated), and each dot represents cells in a single tissue section (five to nine sections per fish). For whole PR EdU counts (right), each dot represents one larva (n = 12 for DMSO, 11 for BMS, and 10 for Cya). I, Schematic showing the Tet-On transgenic system used to manipulate Hh signaling. The Tg(GBS-ptch2:RTTA) line drives expression of the RTTA transcriptional activator in Hh-responsive cells, with different effector transgenes allowing upregulation and downregulation of Hh signaling on the addition of doxycycline, which is required for RTTA function. Activation of the two-part transgenic expression system is indicated by mCherry fluorescence in larvae, as shown in the diagram of the experimental timeline. J–M, Ventral views of EdU-labeled (3-h exposure) proliferative cells in the larval hypothalamus following manipulation of Hh signaling levels using the Tet-On system. J, EdU-labeled proliferative cells (green) in a single-transgenic sibling (control), identified based on the lack of red fluorescence. K, EdU-labeled proliferative cells (green) visualized 12 h after activation of a dominant repressor form of the Gli2 transcription factor (Gli2DR) in Hh-responsive cells (red). L, EdU-labeled proliferative cells (green) visualized following activation of the Shh effector transgene [Tg(TETRE:shha-mCherry)] in Hh-responsive cells [Tg(GBS-ptch2:RTTA) driver]. M, EdU-labeled proliferative cells 12 h after activation of the Gli1-mCherry fusion protein in Hh-responsive cells (red). A subset of EdU-labeled cells was co-labeled with the mCherry protein (arrowheads). Separated EdU, mCherry, and merged channels from the PR of a different brain are shown on the right. N, Quantification of all EdU+ proliferating cells in the PR and LR of the larval hypothalamus following Hh-manipulation using the Tet-On system. Each dot represents an individual fish. Upregulation of Hh/Gli signaling via the shha and gli1 transgenes led to increased proliferation, while downregulation of Hh signaling via the gli2DR transgene reduced proliferation; ***p < 0.001, ****p < 0.0001. Source data for graphs can be found in Extended Data Figure 3-1. Scale bars: 20 μm.

Acknowledgments
This image is the copyrighted work of the attributed author or publisher, and ZFIN has permission only to display this image to its users. Additional permissions should be obtained from the applicable author or publisher of the image. Full text @ eNeuro