
Figure 2—figure supplement 1.
- ID
- ZDB-FIG-201211-15
- Publication
- Kennard et al., 2020 - Osmolarity-independent electrical cues guide rapid response to injury in zebrafish epidermis
- Other Figures
- All Figure Page
- Back to All Figure Page
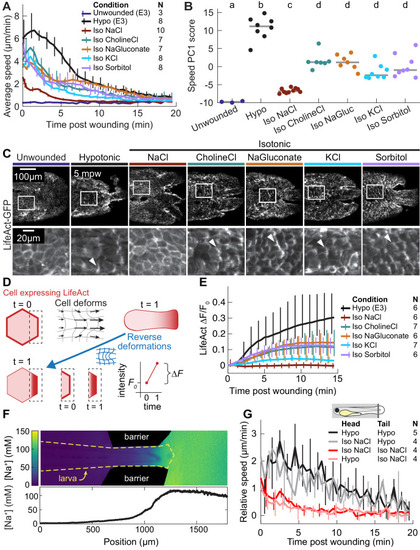
(A) Basal cell speed over time, averaged over 300 µm adjacent to the wound in each larva. 3 dpf larvae expressing LifeAct-EGFP in basal cells (TgBAC(∆Np63:Gal4); Tg(UAS:LifeAct-EGFP); Tg(hsp70:myl9-mApple)) were incubated in E3 (Hypo) or E3 supplemented with 270 mOsmol/l of indicated osmolytes (Iso) and then the tailfin was lacerated and movement analyzed as described in Methods and Figure 1—figure supplement 1. N indicates the number of larvae in each condition. Error bars are bootstrapped 95% confidence intervals of the mean for each condition. (B) Speed trajectories for each larva were analyzed with PCA (see Figure 2—figure supplement 1A–C) and each trajectory’s score along the first principal component is plotted. Gray bars indicate the mean PC1 score for that condition. Letters a-d indicate statistically distinguishable (significantly different) means (p<0.001, one-way fixed-effects Welch’s ANOVA F(6, 19)=130.9, with Games-Howell post-hoc tests). See Table 1 for p-values from post-hoc tests. (C) (Top) Representative tailfins from unwounded larvae or larvae wounded in different media. Images shown from 5 min post wounding. (Bottom) Insets shown below each image. Arrowheads: examples of polarized LifeAct intensity, in the direction of the wound. (D) Schematic of computational procedure for analyzing changes in intensity, after warping image to account for cell/tissue deformation. See Methods for more detail. (E) Relative pixel-wise change in LifeAct intensity over time, averaged over 300 µm adjacent to the wound in each larva. Error bars are bootstrapped 95% confidence intervals of the mean. (F) (Top) Image displaying the device allowing for different media compositions around the tailfin or the rest of the larva. Sodium concentration was calibrated with a sodium-sensitive fluorescent dye. (Bottom) Graph indicates the average sodium concentration along a line across the middle of the image. (G) Relative tissue speed for larvae with different media around their anterior or posterior, as shown in the diagram. To account for residual whole-larva movement due to peristaltic flow, the average tissue speed >300 µm away from the wound was subtracted from the average speed <300 µm away from the wound. Error bars are bootstrapped 95% confidence intervals of the mean. |