FIGURE

FIGURE 5

ID
ZDB-FIG-201121-62
Publication
Henderson et al., 2020 - Hindbrain and Spinal Cord Contributions to the Cutaneous Sensory Innervation of the Larval Zebrafish Pectoral Fin
Other Figures
All Figure Page
Back to All Figure Page
FIGURE 5

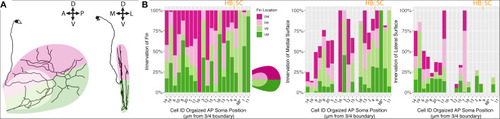
Fin sensory neurons exhibit biases to specific fin areas depending on soma location. (A) A single neuron reconstruction shows coverage of all four quadrants (left panel), and also shows bias toward the medial surface of the fin (right panel). Note: due to the nature of the projection in the right panel, the overlay of the dorsal and ventral shadings is consistent with the shading at the level of the blood vessel. (B) The distribution of primary processes across the fin quadrants including the dorsal membrane (DM, dark pink), dorsal base (DB, light pink), ventral base (VB, light green), and ventral membrane (VM, dark green) (left panel). Notably, the highest percentage of the total length of fibers is found in the medial fin surface (middle panel) across all quadrants compared to the lateral fin (right panel). Soma position values corresponding to the Cell IDs are detailed in Supplementary Table S3.

Expression Data

Expression Detail
Antibody Labeling
Phenotype Data

Phenotype Detail
Acknowledgments
This image is the copyrighted work of the attributed author or publisher, and ZFIN has permission only to display this image to its users. Additional permissions should be obtained from the applicable author or publisher of the image. Full text @ Front. Neuroanat.