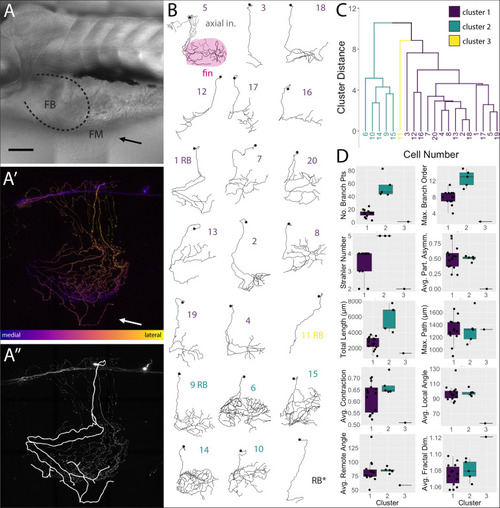
islet2B + neurons innervating the fin fall into three distinct morphological clusters. (A) Brightfield image of 5 dpf larval zebrafish in lateral view. The fin is indicated with a black arrow, and the fin body (FB) is bounded by a dotted line indicating the position of the blood vessel separating the FB and the fin membrane (FM). (A′) A depth coded z-projection of a single islet2B+neuron from the same fish in (A) shows an extensive arborization on the body and some sparse processes visible in the fin (white arrow). (A″) The same z-projection with an overlay of the reconstruction of the primary afferents projecting into the fin. (B) Reconstructions of the primary afferents innervating the fin show a diversity in both innervation pattern and fin coverage. The reconstruction in the top left has the axial innervation included in gray, the rest of the reconstructions are of only the fin innervation. The numbers are color coded to correspond to one of the three clusters in (C). (C) Dendrogram of the results of agglomerative hierarchical clustering analysis using Ward’s method. There are three distinct clusters, color coded to reflect the number labels associated with the neuronal reconstructions in (B). The y-axis indicates the Euclidean distance between clusters and leaves. (D) Box plots of each of the 10 morphological parameters, together with two soma parameters from Figure 3, utilized in the cluster analysis. Boxes are color coded in accordance with cluster number, with the exception of cluster 3, which only contains one cell. Black point overlays indicate the individual values for each neuron. Anterior is to the left, dorsal is up in (A,A′,A″). Scale is 100 microns in (A). N = 21 in (B) and 20 in (C,D).
|
