islet2B + neurons innervate the pectoral fins of 5 dpf larval zebrafish. (A) Brightfield lateral view of a 5 dpf larval zebrafish. Arrow indicates distal fin membrane, and dotted line indicates the blood vessel boundary between the fin body (FB) and fin membrane (FM). (B)Tg[islet2B:GFP] × Tg[mnx1:Gal4;UAS:pTagRFP] double transgenic fish (N = 4) showing sensory neurons and their processes (cyan) and motor neurons and their processes (red). Arrow indicates distal fin membrane. Asterisks indicate DRGs. (C) Depth coded z-projection of islet2B (neurons highlights the lateral placement of the sensory neuron cell bodies compared to the more medially located mnx1+ motor neurons in (D). Asterisks indicated DRGs. Depth scale is the same for (C,D). Anterior is to the left, dorsal is up in all images. Scale is 100 microns.

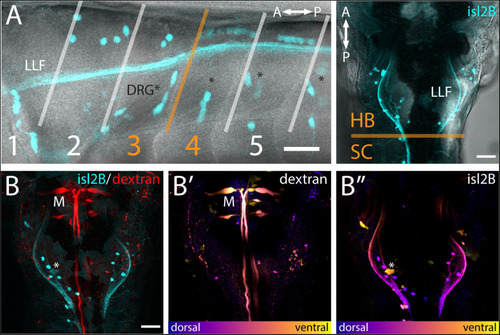
FSNs have somas in the hindbrain and spinal cord. (A) Left panel: Brightfield and fluorescent merged image adjacent to myomeres one through five, indicating the distribution of the islet2B + somas (cyan) innervating the fin. The FSN somas innervating the fin are located dorsal to the dorsal root ganglion (DRG) neurons visible as clusters (asterisks). Fibers from DRGs also projected to the fin at this stage, but they cannot be traced individually. The lateral longitudinal fasciculus (LLF) extends from the hindbrain into the spinal cord. The transition area between myomeres three and four, historically referred to as the transition between the hindbrain and spinal cord, is indicated in orange. Cells posterior to the boundary are located in the spinal cord, and islet2B + cells in this location are Rohon-Beards. Right panel: Brightfield and fluorescent merged image of a dorsal view of a Tg[islet2B:GFP] fish. The hindbrain and spinal cord boundary is again marked in orange. The organization of the sensory neurons along the lateral margins of rhombomere 7/8 is bounded by the LLF. (B) All of the somas (cyan, left panel) are located posterior to the Mauthner neurons (red, M). Additionally, Mauthner neurons are notably more ventral (B′, M) in the hindbrain than the FSNs (B″, asterisk is DRG). Anterior is to the left, dorsal is up in (A left panel). Anterior is up, dorsal view in (A right panel and B). Scale is 40 microns in (A left panel) and 50 microns in (A right panel and B).

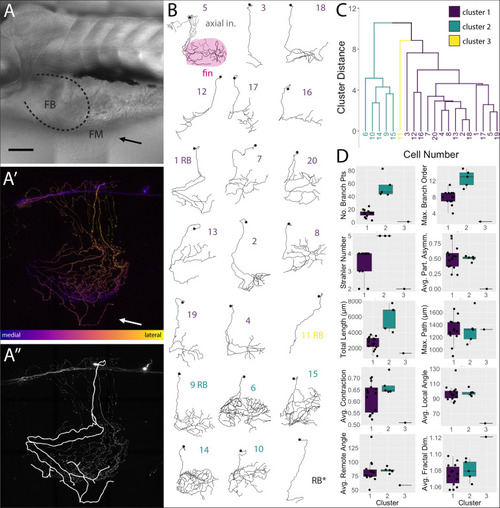
FSNs exhibit a variety of soma morphologies. (A) The four main FSN soma morphologies clockwise from top left: small spherical hindbrain (HB), small teardrop HB, rounded HB with dorsal projection, and a classic dorsally located RB with its dorsoventrally compressed shape resulting in elongation along the anteroposterior axis. The three hindbrain morphologies are apparent across cells associated with myomeres two and three. (B) FSNs are distributed across myomeres two through five, and they show no significant trends in soma size or distribution patterns across the anterior to posterior axis within any of these myomeres. FSNs exhibit no trends with regard to the hindbrain/spinal cord transition area (indicated in orange). Negative numbers are consistent with a hindbrain location, and positive numbers indicate a spinal cord location. Most of the cells innervating the fin are found in myomere three. Anterior is to the left, dorsal is up in (A). Scale is 25 microns in (A).

islet2B + neurons innervating the fin fall into three distinct morphological clusters. (A) Brightfield image of 5 dpf larval zebrafish in lateral view. The fin is indicated with a black arrow, and the fin body (FB) is bounded by a dotted line indicating the position of the blood vessel separating the FB and the fin membrane (FM). (A′) A depth coded z-projection of a single islet2B+neuron from the same fish in (A) shows an extensive arborization on the body and some sparse processes visible in the fin (white arrow). (A″) The same z-projection with an overlay of the reconstruction of the primary afferents projecting into the fin. (B) Reconstructions of the primary afferents innervating the fin show a diversity in both innervation pattern and fin coverage. The reconstruction in the top left has the axial innervation included in gray, the rest of the reconstructions are of only the fin innervation. The numbers are color coded to correspond to one of the three clusters in (C). (C) Dendrogram of the results of agglomerative hierarchical clustering analysis using Ward’s method. There are three distinct clusters, color coded to reflect the number labels associated with the neuronal reconstructions in (B). The y-axis indicates the Euclidean distance between clusters and leaves. (D) Box plots of each of the 10 morphological parameters, together with two soma parameters from Figure 3, utilized in the cluster analysis. Boxes are color coded in accordance with cluster number, with the exception of cluster 3, which only contains one cell. Black point overlays indicate the individual values for each neuron. Anterior is to the left, dorsal is up in (A,A′,A″). Scale is 100 microns in (A). N = 21 in (B) and 20 in (C,D).

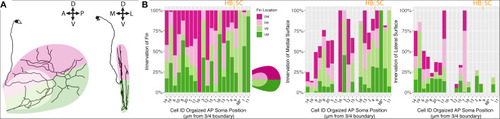
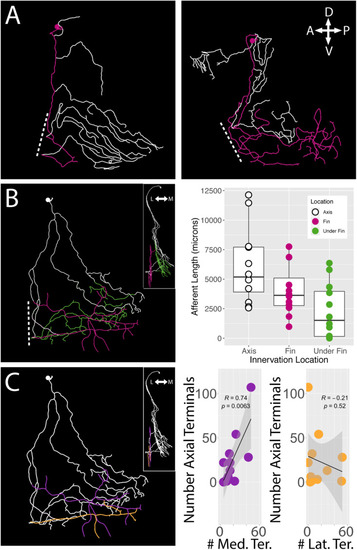
Fin sensory neurons exhibit biases to specific fin areas depending on soma location. (A) A single neuron reconstruction shows coverage of all four quadrants (left panel), and also shows bias toward the medial surface of the fin (right panel). Note: due to the nature of the projection in the right panel, the overlay of the dorsal and ventral shadings is consistent with the shading at the level of the blood vessel. (B) The distribution of primary processes across the fin quadrants including the dorsal membrane (DM, dark pink), dorsal base (DB, light pink), ventral base (VB, light green), and ventral membrane (VM, dark green) (left panel). Notably, the highest percentage of the total length of fibers is found in the medial fin surface (middle panel) across all quadrants compared to the lateral fin (right panel). Soma position values corresponding to the Cell IDs are detailed in Supplementary Table S3.

islet2B+ neurons innervate both the fin and the body axis. A subset of single neuron reconstructions color coded to indicate the axial innervation in white and the fin only innervation in pink. (A)Left, the cell has very little fin innervation and the primary afferent that enters the fin loops back out of the fin. Right, the cell has far more extensive coverage of the fin. (B)Left, a third cell is color coded for axial innervation (white), fin innervation (pink), and axial innervation under the fin (green). The inset image shows a 90 degree rotation of the same fish with the same color coding. Right, there is a substantial amount of axial innervation across all sampled fish, and the amount of axial, fin, or under the fin innervation varies across a wide range of afferent lengths. In general, the whole population has higher primary afferent lengths on the axis compared to the fin. Notably, some fish have zero to very little innervation under the fin. (C)Left, the same reconstruction in (B) is color coded for medial fin innervation (purple) and lateral fin innervation (orange). The inset again shows the same reconstruction rotated 90 degrees. Right, the number of terminals on the medial fin surface is positively correlated with the number of terminals on the axial surface under the fin (purple graph, correlation, p < 0.01). The number of terminals on the lateral fin surface shows no trend in relation to the number of terminals on the axial surface under the fin (orange graph, correlation, p > 0.05). Anterior is to the left, dorsal is up in reconstructions. In insets, medial is to the left and dorsal is up.

Acknowledgments
This image is the copyrighted work of the attributed author or publisher, and ZFIN has permission only to display this image to its users. Additional permissions should be obtained from the applicable author or publisher of the image. Full text @ Front. Neuroanat.