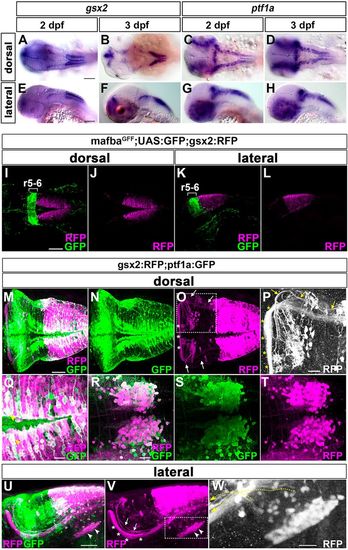
gsx2 and ptf1a are co-expressed in IO progenitors. (A,B,E,F) Expression of gsx2 in 2 and 3 dpf larvae. (C,D,G,H) Expression of ptf1a in 2 and 3 dpf larvae. (I-L) 3 dpf mafbaGFF;UAS:GFP;gsx2:RFP larvae (n=2) were immunostained using anti-DsRed (RFP, magenta) and anti-GFP (green) antibodies. r5-6, rhombomeres 5 and 6. (M-W) 5 dpf gsx2:RFP;ptf1a:GFP larvae were immunostained using anti-DsRed (magenta) and anti-GFP (green) antibodies. Dorsal views (M-T) and lateral views (U-W). (P) Higher magnification of the dotted box in O. (Q) Higher magnification of the dotted box in M (dorsal optical section). (R-T) Expression of GFP and/or RFP in the IO region. (W) Higher magnification of the dotted box in V. White and yellow arrows, and white arrowheads indicate CFs and IO neurons, respectively. Yellow arrowheads indicate both GFP+ and RFP+ cells. Asterisks indicate gsx2:RFP+ axons that are potentially axons from the nucleus commissure of Wallenberg, which sends mossy fibers projecting to GCs. Dotted yellow arrows in W indicate axons from IO neurons. Scale bars: 100 µm in A,E (apply to A-H) and I (applies to I-L); 50 µm in M (applies to M-O) and U (applies to U,V); 20 µm in P-R (bar in R applies to R-T) and W.
|
