
Figure 5
- ID
- ZDB-FIG-201021-14
- Publication
- Helker et al., 2020 - Apelin signaling drives vascular endothelial cells towards a pro-angiogenic state
- Other Figures
-
- Figure 1
- Figure 1—figure supplement 1.
- Figure 1—figure supplement 2.
- Figure 1—figure supplement 3.
- Figure 2
- Figure 2—figure supplement 1.
- Figure 2—figure supplement 2.
- Figure 2—figure supplement 3.
- Figure 3
- Figure 3—figure supplement 1.
- Figure 3—figure supplement 2.
- Figure 4
- Figure 4—figure supplement 1.
- Figure 5
- Figure 5—figure supplement 1.
- All Figure Page
- Back to All Figure Page
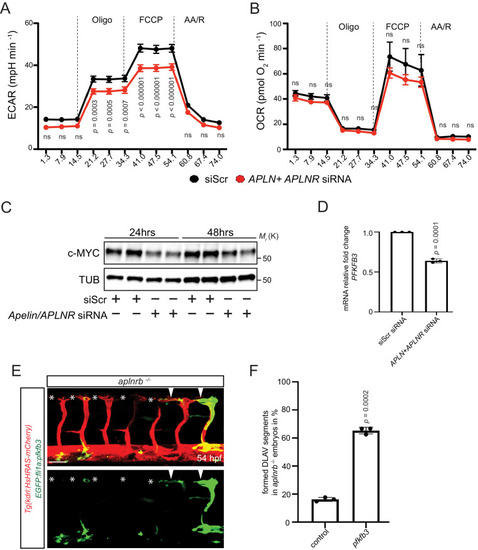
(A - B) Extracellular acidification aate (ECAR) (A) and oxygen consumption rates (OCR) (B) in siScr and APLN+APLNR siRNA-treated HUVECs under basal conditions and in response to oligomycin, fluoro-carbonyl cyanide phenylhydrazone (FCCP) and antimycin A (AA)/rotenone. (A) Reduced basal and maximal glycolytic activity in APLN+APLNR siRNA-treated compared to siScr-treated HUVECs. (B) No significant difference in oxygen consumption in APLN+APLNR siRNA-treated compared to siScr-treated HUVECs. (C) Reduced c-MYC levels in APLN+APLNR siRNA-treated compared to siScr-treated HUVECs. (D) RT-qPCR analysis of PFKFB3 mRNA levels in APLN+APLNR siRNA-treated compared to siScr-treated HUVECs. (E) Confocal projection images of the blood vasculature in the trunk region of a 54 hpf Tg(kdrl:HsHRAS-mCherry) animal injected with an EGFP:fli1a:pfkfb3 plasmid. Arrowheads point to formed DLAV fragments while asterisks indicate missing DLAV fragments. (F) Quantification of the rescue of the DLAV fragment by mosaic pfkfb3 overexpression in aplnrb -/- embryos. n.s. not significant (two-tailed t-test). Scale bar: E, 50 µm.
|