
Figure 4
- ID
- ZDB-FIG-201021-12
- Publication
- Helker et al., 2020 - Apelin signaling drives vascular endothelial cells towards a pro-angiogenic state
- Other Figures
-
- Figure 1
- Figure 1—figure supplement 1.
- Figure 1—figure supplement 2.
- Figure 1—figure supplement 3.
- Figure 2
- Figure 2—figure supplement 1.
- Figure 2—figure supplement 2.
- Figure 2—figure supplement 3.
- Figure 3
- Figure 3—figure supplement 1.
- Figure 3—figure supplement 2.
- Figure 4
- Figure 4—figure supplement 1.
- Figure 5
- Figure 5—figure supplement 1.
- All Figure Page
- Back to All Figure Page
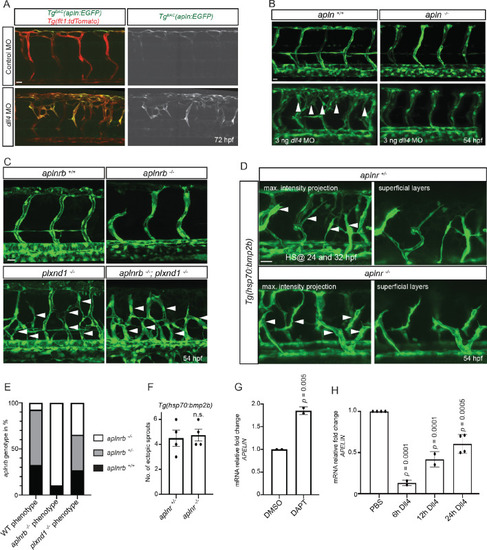
(A - D) Confocal projection images of the blood vasculature in the trunk region of Tg(flt1:tdTomato) (A) and Tg(fli1a:EGFP) (B–D) animals at 54 (B–D) and 72 (A) hpf. (A) Injection of a dll4 morpholino leads to an increase in TgBAC(apln:EGFP) expression. (B) Loss of Apelin function can block excessive endothelial sprouting in dll4 morphants. (C, E) Angiogenic response in aplnrb -/-, plxnd1 -/-, and aplnrb -/-; plxnd1 -/- embryos (arrowheads) (n = 95). (D, F) Angiogenic response to bmp2b overexpression in aplnr +/- and aplnr -/- embryos (arrowheads). (E) Genotype of embryos for aplnrb after sorting them according to phenotype. (G) RT-qPCR analysis of APELIN mRNA levels in HUVECs treated with DAPT for 24 hr. Blocking Notch signaling with DAPT induces APELIN expression. (H) RT-qPCR analysis of APELIN mRNA levels in HUVECs cultured on DLL4 to activate Notch signaling. Activating Notch signaling represses APELIN expression. Arrowheads point to ectopic sprouts. n.s. not significant (two-tailed t-test). Ct values can be found in Figure 4—source data 1. Scale bars: A, C, 20 µm; B, 15 µm; D, 30 µm.
|
| Gene: | |
|---|---|
| Fish: | |
| Knockdown Reagent: | |
| Anatomical Term: | |
| Stage: | Protruding-mouth |
| Fish: | |
|---|---|
| Condition: | |
| Knockdown Reagent: | |
| Observed In: | |
| Stage Range: | Long-pec to Protruding-mouth |