
Fig. 1
- ID
- ZDB-FIG-200908-1
- Publication
- Jerison et al., 2020 - Heterogeneous T cell motility behaviors emerge from a coupling between speed and turning in vivo
- Other Figures
- All Figure Page
- Back to All Figure Page
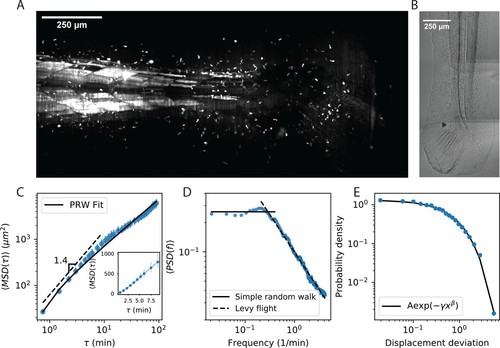
Cell motility behavior is inconsistent with Levy flight. (A) Maximum Z projection of a Tg(lck:GFP, nacre-/-) zebrafish at 12 dpf. This projection represents the first frame of a timecourse; see Figure 1—video 1. (B) Brightfield of the region of tissue shown in A. Stitching across three tiles was performed in ImageJ. (C) Mean squared displacement as a function of time lag. The cells migrate super-diffusively on scales of a few minutes. The MSD for a persistent random walk is fit to the data (Materials and methods, Appendix 1). Error bars represent 95% confidence intervals on a bootstrap over n = 316 trajectories containing all measured time intervals. (See also Figure 1—figure supplement 2). Inset: linear scale for the first 10 min. (D) The velocity power spectrum, averaged across all trajectories (n = 634). A Levy (scale-free) process consistent with the short time behavior would result in a continuation of the high frequency slope (dashed line). Instead, we observe a timescale at a few minutes. (E) Distribution of bout lengths within a trajectory (Materials and methods), fit with a stretched exponential (n = 35819 bouts). The fitted stretch parameter b 1⁄4 :9. For all panels, trajectories were pooled from n = 16 fish. |