
- Title
-
Heterogeneous T cell motility behaviors emerge from a coupling between speed and turning in vivo
- Authors
- Jerison, E.R., Quake, S.R.
- Source
- Full text @ Elife
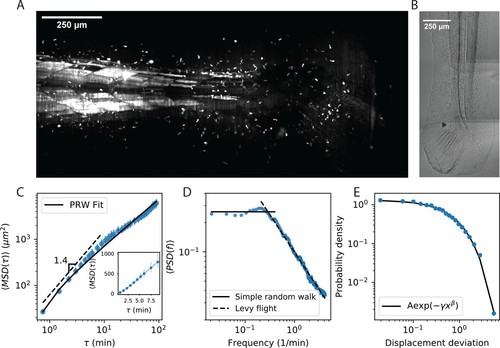
Cell motility behavior is inconsistent with Levy flight. (A) Maximum Z projection of a Tg(lck:GFP, nacre-/-) zebrafish at 12 dpf. This projection represents the first frame of a timecourse; see Figure 1—video 1. (B) Brightfield of the region of tissue shown in A. Stitching across three tiles was performed in ImageJ. (C) Mean squared displacement as a function of time lag. The cells migrate super-diffusively on scales of a few minutes. The MSD for a persistent random walk is fit to the data (Materials and methods, Appendix 1). Error bars represent 95% confidence intervals on a bootstrap over n = 316 trajectories containing all measured time intervals. (See also Figure 1—figure supplement 2). Inset: linear scale for the first 10 min. (D) The velocity power spectrum, averaged across all trajectories (n = 634). A Levy (scale-free) process consistent with the short time behavior would result in a continuation of the high frequency slope (dashed line). Instead, we observe a timescale at a few minutes. (E) Distribution of bout lengths within a trajectory (Materials and methods), fit with a stretched exponential (n = 35819 bouts). The fitted stretch parameter b 1⁄4 :9. For all panels, trajectories were pooled from n = 16 fish. |
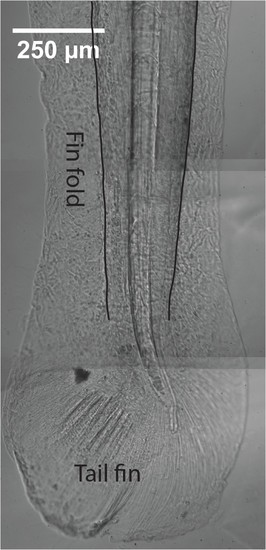
As in Figure 1B, with annotations. Stitched brightfield image of the zebrafish tail, (same as Figure 1B), with the fin fold and tail fin regions indicated. Lines were added at the border between the fin fold and muscle regions of the tail to guide the eye. |