FIGURE

FIGURE 7

ID
ZDB-FIG-200829-92
Publication
Min et al., 2020 - Systems Analysis of Biliary Atresia Through Integration of High-Throughput Biological Data
Other Figures
All Figure Page
Back to All Figure Page
FIGURE 7

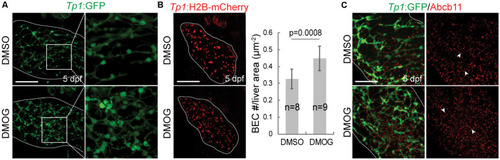
Activation of Hif1a signaling increases BEC number and impairs the proper formation of bile canaliculi. (A) Confocal projection images showing intrahepatic biliary network by Tp1:GFP expression in the liver (dotted lines) at 5 dpf. Boxed regions are enlarged. (B) Confocal projection images showing Tp1:H2B-mCherry expression (red; BEC nuclei) in the liver (dotted lines) at 5 dpf. Quantification of BEC number is shown. (C) Confocal projection images showing Abcb11 and Tp1:GFP expression in the liver (dotted lines) at 5 dpf. Arrowheads point to bile canaliculi. n indicates the number of larvae used for quantification. Scale bars: 50 μm; error bars: ± SD.

Expression Data
Genes:
Fish:
Anatomical Terms:
Stage: Day 5

Expression Detail
Antibody Labeling
Phenotype Data
Fish:
Condition:
Observed In:
Stage: Day 5

Phenotype Detail
Acknowledgments
This image is the copyrighted work of the attributed author or publisher, and ZFIN has permission only to display this image to its users. Additional permissions should be obtained from the applicable author or publisher of the image. Full text @ Front. Physiol.