
FIGURE 4
- ID
- ZDB-FIG-200829-89
- Publication
- Min et al., 2020 - Systems Analysis of Biliary Atresia Through Integration of High-Throughput Biological Data
- Other Figures
- All Figure Page
- Back to All Figure Page
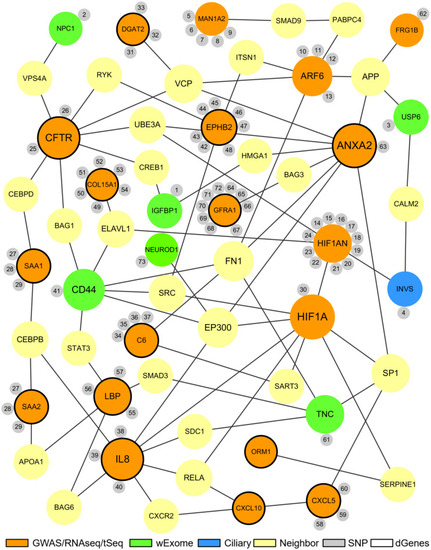
The proposed biliary atresia network. This network was created in Cytoscape by using the second neighbor interactions of the significant genes within the custom human interaction network. Interaction with other significant genes was the key criteria for selection into the final BA network. The size of a node depends on the connectivity within the network; the larger the node, the more connected it is to other genes. The orange nodes represent the significant genes derived from the GWAS, RNAseq, or target sequencing data while the light green nodes represent the significant genes from the whole exome data. One blue ciliary gene is also from the whole exome data. The yellow nodes represent the neighbor genes that link different significant genes through protein-protein interaction. The small gray nodes represent the SNPs that are associated with their attached genes. The entire list of SNPs, both novel and known, can be found in the |