
FIGURE
FIGURE 8
FIGURE 8
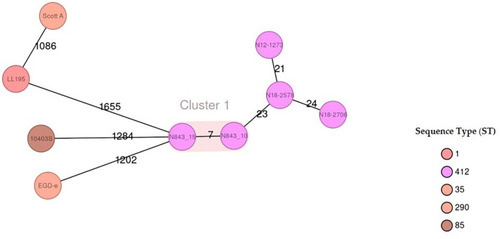
Minimum-spanning tree illustrating the phylogenetic relationship based on cgMLST allelic profiles of the 2 PJI isolates (N843_10 and N843_15) and seven selected reference strains including three CC412 isolates (N12-1273, N18-2578 and N18-2708). Each circle represents an allelic profile based on sequence analysis of 1,701 cgMLST target genes. The numbers on the connecting lines illustrate the numbers of target genes with differing alleles. The different groups of strains are distinguished by the colors of the circles. Clonal strains (cutoff 10 allele difference) are shaded in light brown. |
Expression Data
Expression Detail
Antibody Labeling
Phenotype Data
Phenotype Detail
Acknowledgments
This image is the copyrighted work of the attributed author or publisher, and
ZFIN has permission only to display this image to its users.
Additional permissions should be obtained from the applicable author or publisher of the image.
Full text @ Front Microbiol